How to Calculate Addressable Market for Any Business
Learn how to calculate addressable market (TAM, SAM, SOM) with actionable methods. A clear guide for startups, consulting, and finance professionals.

Figuring out your addressable market isn't just a box-ticking exercise; it's how you prove a business idea is actually worth pursuing. If you're in consulting, finance, or launching a startup, this skill is your currency. It turns a promising idea into a concrete number investors and executives can get behind.
This guide will walk you through the three core methods I've used time and again: Top-Down, Bottom-Up, and Value Theory.
Why Market Sizing Is a Skill You Cannot Ignore

Being able to size a market is a clear signal of structured thinking and solid business sense. It shows you can back up a strategy with real data, which is table stakes in a high-pressure interview or investor pitch. It’s the difference between vaguely claiming "this market is huge" and confidently stating it’s a $2.4 billion opportunity.
The process itself forces you to get specific. Who exactly is your customer? What's the most they'd realistically pay? What external forces—like geography or regulations—cap your growth? Nailing down these answers creates a rock-solid foundation for any business plan or case study.
The Foundation of Strategic Planning
At the end of the day, market sizing is the launchpad for almost every major strategic decision. It gives leaders the clarity they need to allocate resources, prioritize product features, and decide which markets to enter first. To really get a handle on this, you need to understand exactly What is market sizing.
Getting this number right—or at least having a defensible estimate—stops companies from wasting time on opportunities that are too niche or jumping into crowded markets where they can't win.
For anyone aiming for a career in consulting or finance, this is a core competency that gets tested hard in interviews. Interviewers care less about your final answer and more about how you got there. They're testing your ability to break down a complex problem and make smart, logical assumptions on the fly.
Key Takeaway: Market sizing isn’t just about the final number. It’s a narrative that demonstrates your understanding of a business’s potential, its limitations, and the strategic path forward.
Beyond the Total Addressable Market (TAM)
While TAM gives you that big "blue sky" number, a truly sharp analysis doesn't stop there. You have to drill down into what's actually achievable. That’s where SAM and SOM come in, painting a much more realistic picture of the opportunity right in front of you.
Before we dive into the calculations, here's a quick reference to get these concepts locked in.
Quick Guide to Market Sizing Concepts
| Concept | What It Means | Why It Matters |
|---|---|---|
| Total Addressable Market (TAM) | The total revenue opportunity for a product or service if you had 100% market share. It's the whole pie. | Sets the upper limit and shows the maximum scale of the opportunity. Great for big-picture vision. |
| Serviceable Available Market (SAM) | The segment of TAM you can actually reach with your business model, sales channels, and geographic footprint. | Narrows the focus to a realistic target segment, filtering out customers you can't serve. |
| Serviceable Obtainable Market (SOM) | The portion of SAM you can realistically capture within the first few years, given your competition and resources. | Provides a tangible, short-term target for business plans, sales forecasts, and resource planning. |
Getting a firm grasp on these layers is what separates a novice from an expert. It shows you can take a massive market figure and translate it into an actionable business plan—one that acknowledges the real-world constraints that will undoubtedly shape a company's journey.
The Top-Down Approach for a Fast Estimate

When you’re under pressure and need a solid market size estimate—fast—the top-down approach is your best friend. It’s perfect for getting a high-level, big-picture view without getting bogged down in granular details. This makes it a favorite in consulting case interviews and initial investor pitches.
The concept is beautifully simple. You start with a massive, established market figure and then strategically carve it down with logical filters until you arrive at your specific market. Imagine starting with a giant block of marble and chipping away everything that isn't part of your sculpture.
Finding Your Starting Point
This method is arguably one of the most direct ways to calculate your Total Addressable Market. You begin with broad, macroeconomic data from trusted industry research firms like Gartner, Forrester, or IDC, and then narrow your focus down to the segments you can actually reach.
Think of it as an inverted pyramid. You filter a massive population or market value down to your specific target. Anchoring your analysis with a credible, third-party number is key, as investors and interviewers respect these sources, giving your estimate immediate weight.
For a deeper dive into the methodology, the experts at the Corporate Finance Institute offer some excellent resources on its application.
Slicing Down to Your TAM
Once you have that huge macro number, the real analysis begins. You'll apply a series of filters—or assumptions—to zero in on the market segment your business can actually serve. The trick is that each filter must be logical, defensible, and highly specific to your business model.
Let's walk through a real-world scenario. Imagine you're sizing the market for a B2B SaaS company that sells project management software specifically to the European construction industry.
Example: A B2B SaaS Tool for Construction
- Broad Market Figure: You pull a Gartner report stating the global construction industry is valued at €12 trillion. A great, solid starting point.
- Geographic Filter: Your company only operates in Europe. A quick search reveals that Europe accounts for roughly 20% of the global market.
- Calculation: €12 trillion * 0.20 = €2.4 trillion
- Company Size Filter: Your software is built for small-to-medium enterprises (SMEs), not massive corporations. Industry data shows SMEs make up 60% of the European construction market.
- Calculation: €2.4 trillion * 0.60 = €1.44 trillion
- Tech Adoption Filter: Here's where it gets nuanced. Not every construction SME is a potential customer. Based on surveys, you estimate only 15% have the digital maturity and budget to adopt a new project management tool like yours.
- Calculation: €1.44 trillion * 0.15 = €216 billion
Just like that, your top-down TAM estimate is €216 billion. See how we started broad and applied specific, logical constraints? Each step is a crucial assumption.
Pro Tip: Your logic is more important than your final number. In a consulting interview, you must articulate why you chose each percentage. State your sources, explain your reasoning, and be ready to defend every assumption.
Strengths and Weaknesses of the Top-Down Method
No method is perfect, and top-down shines brightest in specific situations. Knowing its pros and cons helps you decide when to use it and, just as importantly, how to frame your findings.
Key Advantages:
- Speed: It’s lightning-fast compared to building an estimate from scratch. This makes it ideal for initial screenings or timed case interviews.
- Data Availability: Finding broad market data from reputable sources is usually straightforward, giving you a strong, credible foundation.
- Simplicity: The logic is intuitive and easy to explain to stakeholders who just need a quick handle on the market potential.
Potential Pitfalls:
- Lack of Precision: This approach relies heavily on assumptions. If your filters aren't well-researched, your final number can be wildly off, leading to significant over or underestimation.
- Risk of Overestimation: It's very easy to be a little too optimistic with your percentages, resulting in an inflated TAM that doesn't reflect the harsh realities of the market. Always step back and ask yourself: does this final number pass the common-sense check?
The top-down approach is a fundamental tool for any strategist. It provides a structured, efficient way to frame an opportunity and forces you to think critically about the true boundaries of your target market from day one.
Building Your Market from the Ground Up

If the top-down method is a quick sketch, the bottom-up approach is the detailed architectural blueprint. This is the gold standard when precision is non-negotiable, which is why it’s a favorite in consulting and finance interviews. It forces you to think like an operator who’s actually building the business, not just an analyst looking at it from 30,000 feet.
Instead of starting with a massive, abstract market figure, you build your estimate from individual, verifiable data points. The core idea is simple: you identify specific customer segments, count how many potential buyers are in each, and then multiply that by how much they're likely to spend.
It’s granular, it's defensible, and it’s deeply rooted in the reality of your specific business. This method strips away the broad, fuzzy assumptions of a top-down view and replaces them with concrete calculations you can stand behind.
Identifying and Quantifying Customer Segments
Your first job in a bottom-up analysis is to deconstruct your potential market into distinct, measurable customer groups. You can't just say "people in New York City"; you have to get far more specific. Who are these people, really? What makes them tick, and why would they buy from you?
Let’s run through an example to make this concrete. Imagine your task is to calculate the addressable market for high-end electric bicycles (e-bikes) in a city like Denver, which has a population of roughly 711,000.
We can break down potential buyers into a few key personas:
- Urban Commuters: These are professionals looking to replace a car or public transport for their daily trip to the office.
- Recreational Cyclists: Think weekend riders who want an electric boost for longer trips or to finally conquer those big hills.
- Delivery Services: This group includes gig economy workers and local businesses using e-bikes for food or parcel delivery.
Each of these segments has totally different needs, purchase drivers, and spending habits. Grouping them allows for a much more accurate estimate than applying a single, generic assumption to the entire city. Getting this part right is a crucial step when you need to calculate addressable market with any degree of precision.
Working with Data and Justified Assumptions
Now comes the detective work. You need to find real data to estimate the size of each segment. This is where you demonstrate your resourcefulness—a skill highly valued in any analytical role, especially in interviews.
You’ll almost never find a perfect report that just hands you the numbers. The real skill is in using proxies and triangulating from various sources.
- For Urban Commuters: You could start with census data on Denver's working population, which is around 400,000. Obviously, not all are candidates. You'd then filter this by income level (high-end e-bikes are expensive), typical commute distance (e-bikes are perfect for 2-15 mile trips), and access to existing cycling infrastructure. You might reasonably assume 5% of this qualified group are potential early adopters.
- For Recreational Cyclists: Here, you could look at local park usage data, the membership numbers for cycling clubs, or even sales data from traditional bike shops. If there are 50,000 active club cyclists, you might project that 10% are seriously in the market for a high-end e-bike upgrade.
- For Delivery Services: Try to find data from platforms like Uber Eats or DoorDash on the number of active delivery riders in the city. If you find there are 10,000 gig workers, you could estimate that 20% would invest in an e-bike to boost their efficiency and earnings.
Key Takeaway: A bottom-up analysis lives or dies by the quality of your assumptions. Always state them clearly and explain why you believe they are reasonable. For example: "I'm assuming a 5% adoption rate among commuters, which is based on adoption curves for similar consumer tech products in affluent urban areas."
Bringing It All Together
Once you have a solid count of potential customers in each segment, the final piece of the puzzle is figuring out what they'll spend. This just means estimating the Average Revenue Per User (ARPU) or, in this case, the price of the product.
Let's finalize our Denver e-bike market calculation. Assume a high-end e-bike costs $3,000.
| Customer Segment | Potential Customers | Calculation | Segment Size (Customers) | Price Per Unit | Segment Market Value |
|---|---|---|---|---|---|
| Urban Commuters | 400,000 | 400,000 * 5% | 20,000 | $3,000 | $60,000,000 |
| Recreational Cyclists | 50,000 | 50,000 * 10% | 5,000 | $3,000 | $15,000,000 |
| Delivery Services | 10,000 | 10,000 * 20% | 2,000 | $3,000 | $6,000,000 |
| Total | 27,000 | $81,000,000 |
By building our estimate from the ground up, we arrive at a TAM of $81 million for high-end e-bikes in Denver. This number is far more credible than a top-down guess because every component is transparent and can be debated or refined with better data. This is exactly the kind of detailed, logical thinking that interviewers are looking for.
Sizing Markets for Disruptive Innovation
Top-down and bottom-up analyses are your bread and butter when you're sizing an existing market. They work beautifully. But what happens when the market doesn't exist yet? How do you measure the size of something that's never been sold before?
This is a classic problem for genuinely disruptive products—the kind that create entirely new categories. If you're pitching a groundbreaking technology, traditional methods will come up empty. This is where you need a more advanced technique: the Value Theory approach.
Shifting from Spending to Value Creation
The core idea here is to completely reframe the question. Instead of asking, "What do people already spend on this?" you ask, "What is the economic value my solution creates for the customer?"
You stop counting existing budgets and start quantifying the cost of the problem you're solving. How much money, time, or resources are your potential customers losing right now because your solution isn't in their hands? That number—the cost of the pain point—is the foundation of your entire market size.
This method is especially powerful when you’re building a market entry strategy framework for a product with no direct competitors. You anchor your analysis in tangible, quantifiable value, which builds a far more compelling case than pure speculation.
Let's walk through an example. Imagine a startup develops AI software that helps e-commerce companies slash the waste generated from product returns. There’s no budget line for "AI-powered return reduction," so a typical analysis just won't work.
Quantifying the Cost of the Problem
First, you have to get specific and quantify the customer's pain. This means rolling up your sleeves and doing some real investigative work.
Your research might turn up a few key data points:
- A typical mid-sized e-commerce company in your target segment does about $50 million in annual revenue.
- Industry data shows a whopping 20% of all online purchases get returned. For this company, that's $10 million a year lost to logistics, restocking, and unsellable goods.
- Your software, based on pilot programs, can reduce that waste by an estimated 30%.
Right there, you've found the tangible value your software creates for just one customer: $3 million per year ($10 million in return costs × 30% reduction). This becomes your anchor.
Estimating a Customer's Willingness to Pay
Of course, no customer is going to hand over 100% of the value you create. A solid rule of thumb, especially in B2B, is that customers are willing to pay somewhere between 10-20% of the value they receive. This is a crucial assumption, and in any analysis, you need to state it and be ready to defend it.
Let's play it safe and assume a 10% value capture rate.
Willingness to Pay Calculation: $3,000,000 (Annual Value Created) × 10% (Value Capture) = $300,000 (Annual Contract Value)
This $300,000 is your potential annual revenue from a single mid-sized e-commerce client. It’s a price point derived directly from the value you deliver, which makes it incredibly defensible.
Building the Final Market Size
The final piece of the puzzle mirrors the classic bottom-up approach. You just multiply your potential revenue per customer by the total number of customers out there.
Let's say your research shows there are 1,000 mid-sized e-commerce companies in your target geography that fit your ideal customer profile.
- Final TAM Calculation: 1,000 companies × $300,000 Annual Contract Value = $300 million
And just like that, you've built a credible, $300 million addressable market for a product that didn't exist before. The value theory method reorients the entire calculation from what was spent to the value that will be delivered. It forces you to do your homework and validate your assumptions, but the result is a TAM estimate grounded in real-world impact. To see more on this, check out some great insights on a startup's TAM at burklandassociates.com.
This approach is powerful because it demands a deep, almost obsessive, understanding of customer pain points. In a consulting interview, using this framework demonstrates that you can think from first principles and analyze an opportunity beyond the available data—a skill that will always make you stand out.
Moving From TAM to a Realistic Business Plan
Calculating your Total Addressable Market (TAM) is exhilarating. It gives you that massive, headline-grabbing number—the theoretical ceiling for your business, the entire universe of potential revenue. But here’s a tip for any consulting interview or investor pitch: stopping at TAM is a rookie mistake. It signals big-picture vision but shows a complete lack of a credible plan for getting there.
The real test of business acumen isn't just sizing the ocean; it's showing how you'll actually start fishing. This is where you bring in the rest of the funnel: TAM, SAM, and SOM. This framework is your best tool for translating a broad market opportunity into a focused, actionable business strategy. It proves you understand the real-world constraints that come with actually launching and scaling a company.
Defining Your Serviceable Available Market
Your Serviceable Available Market (SAM) is the first crucial reality check. It forces you to answer the question, "Of the entire market, which slice can my business actually reach with its current model?" This step immediately grounds your analysis by applying practical limitations.
These constraints aren't generic; they are specific to your business and how it operates. The most common filters you'll apply are:
- Geography: Is your TAM global, but your sales teams are only in North America? Then North America is your SAM.
- Distribution Channels: If your product is sold exclusively through high-end boutiques, you have to exclude anyone who only shops online or at big-box retailers.
- Language or Regulation: A software product only available in English or one that isn't GDPR-compliant has a SAM that naturally excludes non-English speakers or the entire EU.
Let’s go back to our B2B SaaS tool for the European construction sector. We established its TAM was €216 billion. Now, let's say your sales and support teams are only equipped to serve clients in Germany, Austria, and Switzerland (the DACH region). If industry reports show the DACH region accounts for 25% of the European SME construction market, your SAM instantly becomes much more focused.
Your math is straightforward:
- SAM Calculation: €216 billion (TAM) * 0.25 = €54 billion
This €54 billion figure is far more useful for any near-term planning. It represents the portion of the market you can legitimately go after right now.
From Available to Obtainable Market
The final, and most critical, step is defining your Serviceable Obtainable Market (SOM). This is your real-world target for the next 1-3 years. SOM answers the ultimate question: "Given our direct competition and internal resources, what piece of the SAM can we realistically capture?"
This calculation demands a sober look at the competitive landscape and your own company's strengths and weaknesses. It forces you to think hard about market share. Who are the incumbents? What truly makes you different? How effective is your sales team? Honesty here is absolutely crucial.
Sticking with our SaaS example, your SAM is €54 billion. But you're not operating in a vacuum. Let's imagine your research shows two large, established competitors already own a combined 60% of the market, and a handful of smaller players are scrapping for another 20%.
In a crowded market, gunning for a 2-5% share of your SAM within the first few years is often considered an aggressive but realistic goal.
This is where understanding the link between the problem you solve and the value you create becomes the foundation for your market size estimate.
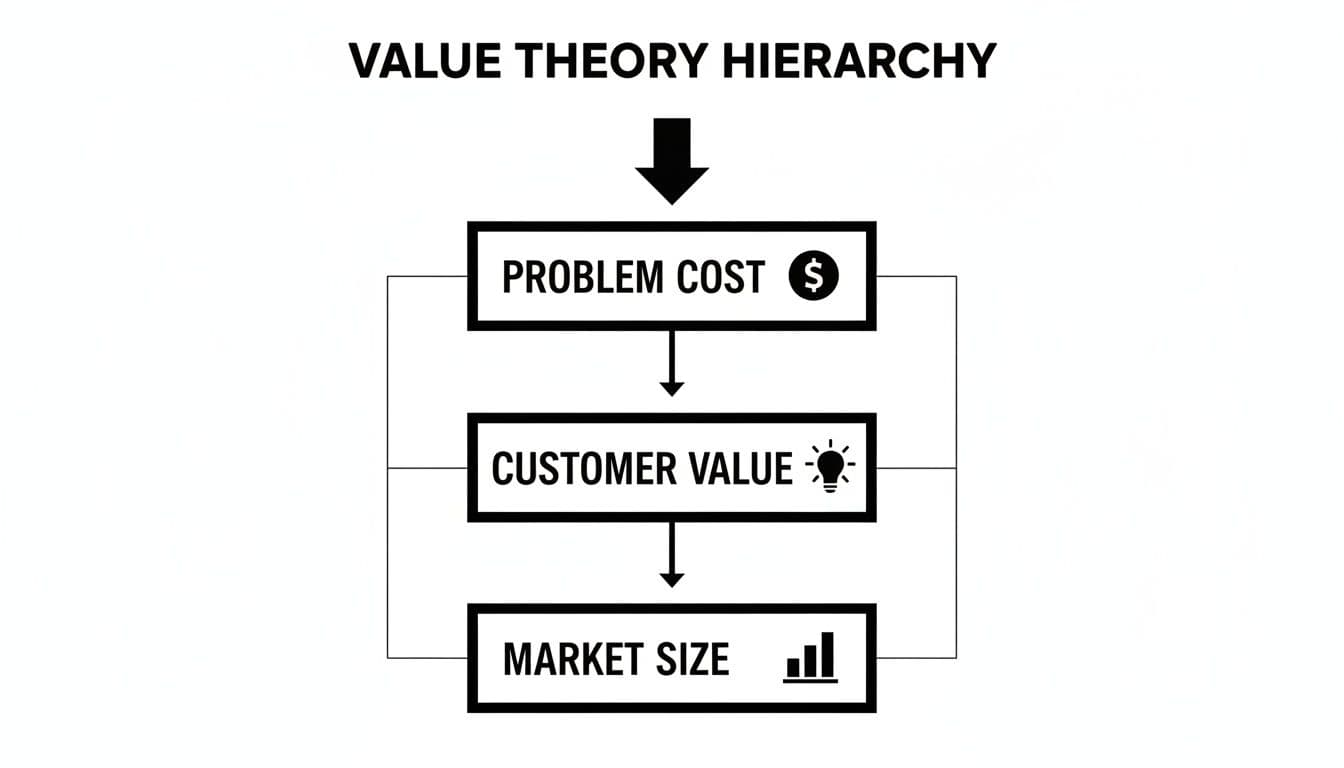
As you can see, a deep understanding of the cost of the problem is what allows you to create customer value, which in turn defines the market's true potential.
So, let's be optimistic and say you can capture a 3% market share within three years.
- SOM Calculation: €54 billion (SAM) * 0.03 = €1.62 billion
That €1.62 billion is your SOM. It’s a powerful, defensible number. It’s not a wild guess; it’s a strategic target derived from a logical, top-down filtering process. Presenting the full TAM-SAM-SOM funnel shows you not only understand the theory but can also build a believable roadmap from vision to revenue. It's this transition from abstract potential to a concrete plan that will truly impress.
To see how these numbers feed directly into your financial models, you can learn more by exploring our guide on what is unit economics.
Common Interview Mistakes and Pro Tips
Getting the numbers right is just the price of entry. In a high-stakes interview, how you arrive at your answer and what you do with it is what sets the top candidates apart from the rest of the pack. I've seen countless smart people stumble over the same predictable hurdles. Knowing what they are beforehand gives you a massive edge.
One of the quickest ways to lose credibility is by pulling assumptions out of thin air. For example, simply stating, "Let's assume 10% of the population is our target market" is a huge red flag. Why 10%? Is it based on income levels, age demographics, or a known industry benchmark? Every assumption needs a defense, even a quick one. Interviewers are paid to find the weak spots in your logic.
Failing the Sanity Check
Here’s another classic mistake: you’re so deep in the weeds of your calculation that you completely lose perspective. You get to the end and proudly announce that the annual market for pet food in Des Moines is $500 million.
Stop. Pause. Does that number sound remotely plausible? A quick gut check is your best friend. Taking a moment to ask yourself, "Does this number make sense in the real world?" demonstrates commercial acumen, a skill every consulting firm and investment bank covets. It shows you're not just a calculator.
Pro Tip: If you catch a math error or realize an assumption was way off, don't try to hide it. Address it head-on. Saying, "On second thought, I think my initial adoption rate is too aggressive. I'd like to revise that because..." shows you're confident, adaptable, and able to self-correct under pressure. That's far more impressive than stubbornly defending a flawed number.
Forgetting the "So What"
Calculating the market size is just the "what." The real value, the insight the client is paying for, comes from the "so what." The best candidates don't wait to be asked; they proactively bridge their calculation to business strategy. What does your final number actually mean?
- Is this market even big enough to be interesting for a Fortune 500 client?
- Does the fragmentation suggest an opportunity for a private equity roll-up play?
- Is the obtainable market (SOM) large enough to hit the startup's 5-year growth targets?
This is where you shift from a student solving a math problem to a consultant solving a business problem. Connecting your quantitative work to a strategic recommendation is the knockout punch. To nail this delivery, it’s worth thinking about how to prepare for job interviews effectively so you can present your big-picture insights with poise.
Communicating Your Logic Clearly
Don't make the interviewer work to understand you. Many candidates get lost in their own heads, crunching numbers silently and only sharing the final answer. Your interviewer can't read your mind. You have to walk them through your thought process, step by step.
Think of it like narrating a story. Start with your high-level approach, then break down the population, explain each assumption as you make it, and show your math out loud. This structured, transparent communication isn't just an interview trick—it's exactly what consultants do every day. To see this in action, check out the walkthroughs in our library of market sizing questions.
Answering Those Tricky Market Sizing Questions
Once you’ve got the hang of the core methods, you'll start running into those tricky edge cases that always seem to come up in an interview. Let's walk through a few of the most common curveballs so you're not caught off guard.
"What If I Can't Find Good Data?"
This is less of a problem and more of an opportunity to show how you think on your feet. It happens all the time in the real world, and your interviewer wants to see how you handle ambiguity. Don't freeze up.
The key is to find a reasonable proxy and clearly state your assumption. For example, if you can't find a direct count of coffee shops in a city, what could you use instead? You could start with the city's population. You might assume there's roughly one coffee shop for every 2,000 residents in a dense urban area.
Is that number perfect? No. But is it a logical, defensible starting point? Absolutely. That's what they're looking for.
Remember, the best answer isn't always the most precise one; it's the one that's most logically defended. Interviewers care about your thought process, not whether you've memorized obscure industry stats.
Top-Down or Bottom-Up in an Interview?
So, which approach should be your go-to when the clock is ticking? It really depends on what the interviewer is asking and how much detail they've given you.
Here's a simple rule of thumb:
- Top-Down is your best bet for a quick, "back-of-the-envelope" estimate. It's perfect for broad questions like, "What's the market for electric vehicles in the EU?"
- Bottom-Up is the way to go when you need more precision and the prompt is specific. Think of questions like, "What's the potential annual revenue for a new Starbucks on this particular city block?"
If you're really trying to impress (and you have the time), try a quick version of both. Comparing the two answers is a technique called triangulation, and it's a powerful way to show you can attack a problem from multiple angles and sanity-check your own numbers. It proves you understand the market from both a high-level macroeconomic view and from the ground up.
Ready to stop just reading about market sizing and actually master it? Soreno offers an AI-powered practice platform that's packed with cases and drills designed to sharpen these exact skills. You can practice with an AI interviewer that acts like a real MBB consultant, get instant, detailed feedback, and see exactly where you need to improve.
Start a free trial at https://soreno.ai and walk into your next interview feeling prepared and confident.