What Is Unit Economics A Guide to Sustainable Growth
Understand what is unit economics and why it's the key to profitability. Our guide breaks down LTV, CAC, and the metrics that drive sustainable business growth.

Let's cut right to the chase.
Unit economics is all about measuring your business's profitability on a per-unit basis. Forget the big, overwhelming numbers like total revenue and total costs for a second. We're zooming in. The goal is to figure out if you actually make or lose money on a single "thing" you sell—be it a product, a subscription, or even one customer.
It's the simplest, most fundamental question you can ask about your business: Is the core of what I'm doing actually sustainable?
Understanding Unit Economics Without the Jargon
Think about a classic lemonade stand. It's the perfect way to understand this.
You sell each cup of lemonade for $1.00. That's your revenue for one unit. But it's not pure profit. You had to spend $0.20 on lemons, $0.10 on sugar, and $0.05 on the cup. All in, your cost to make that single cup is $0.35.
So, for every cup you sell, you pocket $0.65 in profit. That simple calculation—revenue per unit minus cost per unit—is the very soul of unit economics.

This idea doesn't just apply to lemonade stands; it scales up to every business imaginable. The "unit" just changes depending on the business model. It could be:
- A single software subscription for a SaaS company.
- One new customer you've just acquired.
- An item sold through your e-commerce store.
- A single ride booked on an app like Uber or Lyft.
By isolating the profitability of this core, repeatable transaction, you get a crystal-clear picture of your company's financial health. It cuts through the noise of high-level financial statements and shows you whether the engine of your business is actually working.
Why Does This Simple Idea Matter So Much?
Here’s the thing: understanding your unit economics is what separates a business with real, long-term potential from one that's just burning through cash to stay alive. A company can boast millions in revenue, but if it’s losing money on every single customer it brings on board, that growth is just a fast track to failure. Eventually, the funding dries up.
Unit economics is the ultimate health indicator. It tells you whether adding more customers will lead to a bigger profit or just a bigger loss. It’s the difference between building a scalable business and a leaky bucket.
When you have positive unit economics, every new sale or customer adds a little more cash to your bottom line. That signals a strong business model, smart operations, and a clear path to becoming a profitable company. That’s precisely what founders need to know, what leaders need to manage, and what investors are looking for.
Without this fundamental health at the unit level, a business is built on a house of cards—no matter how impressive its top-line revenue might seem.
The Core Metrics That Drive Unit Economics
To really get a handle on unit economics, you have to know the metrics that make it all tick. Think of them as the vital signs for your business model. These aren't just numbers on a spreadsheet; they're direct signals of your company's health, efficiency, and whether it has a real future.
Let’s break down the essential components you need to master.
Customer Acquisition Cost (CAC)
First things first: how much does it cost you to land a new customer? That's your Customer Acquisition Cost (CAC). It’s a simple but powerful number that bundles all your sales and marketing spend over a set period and divides it by the number of new customers you actually won.
Imagine your SaaS company spent $10,000 on Google Ads and sales commissions last month. If all that work brought in 100 new subscribers, your CAC is pretty easy to figure out.
Formula:
Total Sales & Marketing Costs / Number of New Customers Acquired = CAC
Example:
$10,000 / 100 customers = $100 CAC
So, you paid $100 for each new customer. Knowing this is the starting point, but the number is basically useless until you figure out what that customer is actually worth to you.
Customer Lifetime Value (LTV)
This brings us to the other side of the coin: Customer Lifetime Value (LTV). This metric is all about forecasting the total revenue you can expect from a single customer over their entire relationship with your company. It answers the most important question: "How much money will this customer bring in over time?"
Calculating LTV isn't just a guess; it's based on a few key pieces of data:
- Average Revenue Per User (ARPU): How much you make from each customer in a given period, like a month or a year.
- Gross Margin: The slice of revenue you keep after paying for the direct costs of your product or service (COGS).
- Customer Lifetime: The average amount of time a customer sticks around before they cancel or stop buying.
For a subscription business, the easiest way to estimate this is by using your churn rate—the percentage of customers who leave each month.
Formula:
LTV = (ARPU * Gross Margin %) / Customer Churn Rate
Example: Let's stick with our SaaS company. Say your ARPU is $50/month, your gross margin is a healthy 80%, and your monthly churn rate is 5%.
LTV = ($50 * 0.80) / 0.05 = $40 / 0.05 = $800
What this tells you is that, on average, every new customer you sign up is worth $800 in gross profit over their entire lifespan.
The All-Important LTV to CAC Ratio
Now, let's put it all together. The LTV to CAC ratio is the scoreboard for your entire business model. It pits the value a customer brings against what you spent to get them. In one simple number, it tells you if you're building a sustainable company or just burning cash.
A fundamental metric for assessing the health of your business, the LTV:CAC ratio compares the total value a customer brings to the cost of acquiring them, serving as a critical indicator within unit economics.
If your ratio is above 1:1, you're making more from customers than you spend acquiring them. Fantastic. If it's below 1:1, you're losing money on every single sale—a recipe for disaster.
Formula:
LTV / CAC
Using our previous examples:
$800 LTV / $100 CAC = 8
An LTV to CAC ratio of 8:1 is stellar. For SaaS businesses, a common rule of thumb is that a ratio of 3:1 or higher signals a strong, scalable model. A 1:1 ratio means you're on a treadmill, just breaking even on your marketing spend, and anything less means you have a serious problem to fix.
Contribution Margin
While LTV and CAC paint the big picture, the Contribution Margin gives you a much closer look at profitability on a per-unit basis. It measures the cash you have left over from a single sale after accounting for all the variable costs tied directly to that sale.
What counts as a variable cost? Anything that goes up when you sell one more item. Think about things like:
- Raw materials or wholesale costs
- Payment processing fees
- Shipping and handling
- Specific customer support tied to that unit
This calculation intentionally leaves out fixed costs—like rent, software subscriptions, or executive salaries—to show you how much each sale "contributes" toward paying those bigger bills and, eventually, generating profit.
Formula:
Contribution Margin = Revenue Per Unit - Variable Costs Per Unit
Example: Let's say an e-commerce store sells a pair of sneakers for $120. The variable costs are the wholesale price of the shoe ($40), credit card fees ($4), and shipping ($6).
$120 - ($40 + $4 + $6) = $120 - $50 = $70
The contribution margin here is $70. Every time a pair of sneakers sells, that $70 is what's available to cover fixed costs like warehouse rent and employee salaries. Getting comfortable with these numbers is a core business skill, and for a deeper look, our guide on how to analyze financial statements is a great next step. Ultimately, understanding contribution margin is key to making smart pricing decisions and knowing if you're actually making money on each transaction.
How Unit Economics Work in Different Business Models
The real power of unit economics isn’t in the theory; it’s in seeing how it plays out on the ground. The core principle is always the same—make more from a customer than you spend to get them—but the definition of a "unit" and the metrics that truly matter shift dramatically depending on the business you're running.
Let's get practical and break down how to calculate unit economics for three very different business models: Software-as-a-Service (SaaS), E-commerce, and Marketplaces. By walking through some real numbers, you’ll see just how flexible and insightful this analysis can be.
At its heart, the entire concept boils down to a simple, powerful relationship.
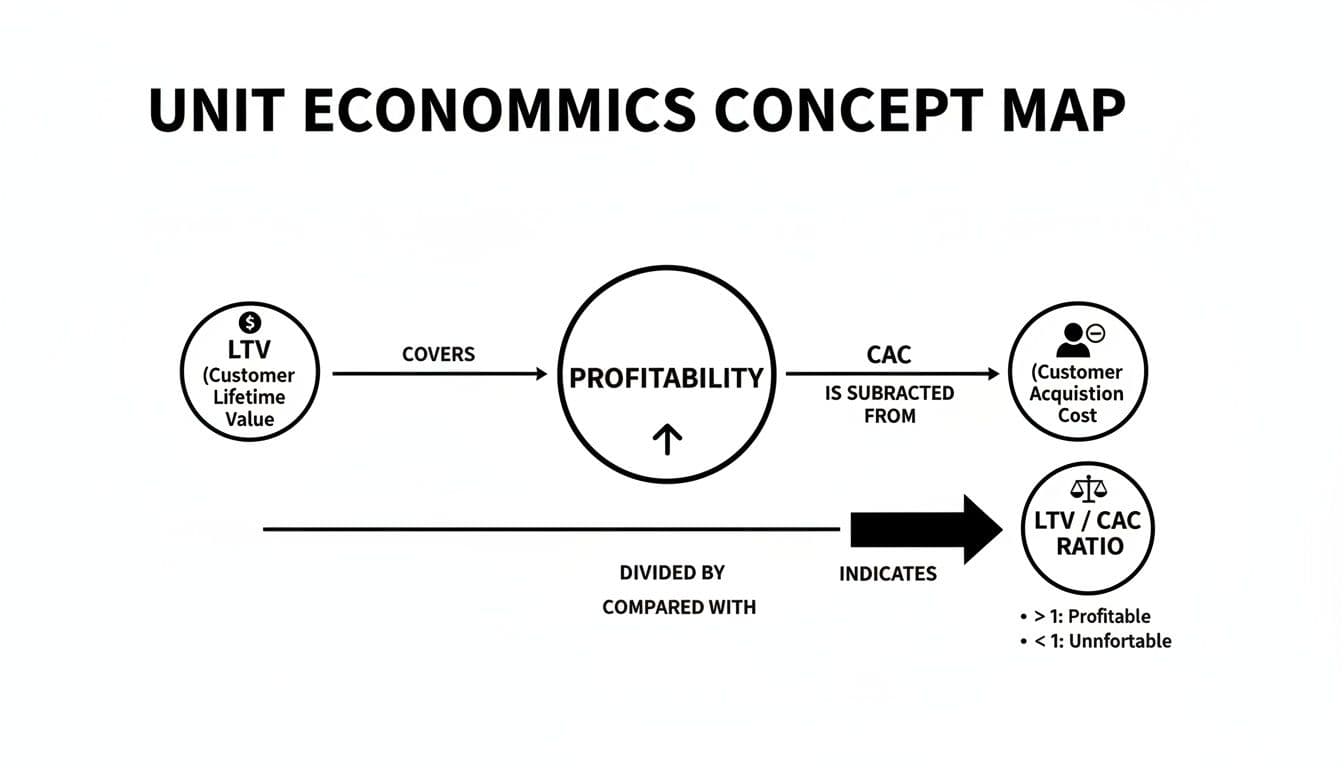
This image nails it: a healthy business is one where the value a customer brings in (LTV) comfortably covers what it cost to get them in the door (CAC).
The SaaS Subscription Model
For any SaaS company, the unit is almost always a single paying customer or subscription. The entire business is built on a foundation of recurring revenue, so everything hinges on understanding the long-term value and loyalty of each subscriber.
Here, metrics like monthly recurring revenue (MRR), churn rate, and LTV are the stars of the show. The game is to make sure the lifetime value of a subscriber blows past the cost of signing them up.
SaaS Example Walkthrough: Let's look at "SyncUp," a fictional B2B project management tool.
- Unit: One subscribed customer.
- Average Revenue Per Account (ARPA): $200 per month.
- Gross Margin: 85% (after factoring in cloud hosting and customer support costs).
- Monthly Churn Rate: 2.5% of customers cancel their subscriptions each month.
- Customer Acquisition Cost (CAC): It costs $1,500 in marketing and sales efforts to land one new customer.
First, we need to figure out how long the average customer sticks around.
Customer Lifetime = 1 / Churn Rate = 1 / 0.025 = 40 months
So, the average customer stays with SyncUp for a solid 40 months.
Now we can calculate what that customer is actually worth in terms of profit.
LTV = (ARPA * Gross Margin %) * Customer Lifetime = ($200 * 0.85) * 40 = $170 * 40 = $6,800
Finally, we get to the magic number: the LTV to CAC ratio.
LTV:CAC Ratio = $6,800 / $1,500 = 4.53
An LTV:CAC ratio of 4.53:1 is fantastic. It means that for every $1 SyncUp invests to win a new customer, it gets $4.53 back in gross profit over that customer's lifetime. That’s a sustainable growth engine.
The E-commerce Retail Model
In e-commerce, the "unit" can be defined two ways: as a single order or as a single customer. Looking at a single order is perfect for dialing in your pricing and shipping strategy. Analyzing a single customer, on the other hand, helps you understand repeat purchase habits and brand loyalty.
For this example, we’ll zero in on the profitability of a single order by calculating its contribution margin. This tells us if each sale is actually generating cash to help cover fixed costs like warehouse rent and marketing team salaries.
E-commerce Example Walkthrough: Picture an online apparel store called "Modern Threads."
- Unit: One completed order.
- Average Order Value (AOV): Customers typically spend $90 per order.
- Cost of Goods Sold (COGS): The actual clothing in the average order costs $30 to produce.
- Variable Costs:
- Payment Processing Fee: 3% of AOV ($2.70)
- Shipping & Handling: $7.00
- Packaging: $1.50
Let’s calculate the Contribution Margin for one order.
Contribution Margin = AOV - COGS - All Other Variable Costs
Contribution Margin = $90 - $30 - ($2.70 + $7.00 + $1.50) = $90 - $30 - $11.20 = $48.80
This $48.80 is the pure profit Modern Threads makes from the average sale before accounting for its fixed, operational costs. Every time someone clicks "buy," this is the amount that goes directly toward paying for software, rent, and salaries. That’s a critical number for managing cash flow.
If the specific marketing ad that drove this order cost $20, the true net profit on this single transaction would be $28.80.
The Two-Sided Marketplace Model
Marketplaces like Uber, Airbnb, or Etsy add a layer of complexity because they serve two distinct "units" at once: buyers and sellers (or riders and drivers). The health of the platform depends entirely on keeping the economics balanced for both sides.
The most important metric here is the take rate—the commission or fee the marketplace keeps from each transaction. The unit economic analysis usually focuses on a single transaction, like one ride or one booking.
Marketplace Example Walkthrough: Let's break down a fictional ride-sharing app, "GoThere."
- Unit: One completed ride.
- Gross Merchandise Value (GMV): The rider pays a total of $25 for the trip. This is the transaction's GMV.
- Take Rate: GoThere keeps 20% of the GMV as its revenue.
- Driver Payout: The driver earns the other 80% ($20).
- Platform Revenue:
GMV * Take Rate = $25 * 0.20 = $5.00
That $5.00 is what GoThere has to run its business. But it's not all profit. The platform has its own variable costs tied to every single ride.
- Variable Costs Per Ride:
- Payment Processing Fees: $0.80
- Insurance Costs: $0.40
- Rider & Driver Promotions/Subsidies: $1.00
Now, let's calculate GoThere's contribution margin per ride.
Contribution Margin = Platform Revenue - Variable Costs = $5.00 - ($0.80 + $0.40 + $1.00) = $5.00 - $2.20 = $2.80
So, for every $25 ride, GoThere makes just $2.80 to put toward its massive fixed costs like engineering, marketing, and corporate staff. This single number perfectly illustrates why scale is everything for marketplaces; they need millions of these small-margin transactions to have any chance at profitability.
While the core principles of LTV and CAC are universal, the way you define your "unit" and calculate profitability can look very different. The table below summarizes how the key calculations adapt across these business models.
Unit Economics Calculation by Business Model
| Metric | SaaS Calculation Example | E-commerce Calculation Example | Marketplace Calculation Example |
|---|---|---|---|
| The "Unit" | One Customer/Subscription | One Order (or One Customer) | One Transaction (e.g., a ride) |
| Top-Line Value | ARPA (Average Revenue Per Account) | AOV (Average Order Value) | GMV (Gross Merchandise Value) |
| Revenue | ARPA (e.g., $200/mo) | AOV (e.g., $90) | GMV * Take Rate (e.g., $25 * 20% = $5) |
| Key Profit Metric | LTV = (ARPA * GM%) * Lifetime | Contribution Margin = AOV - COGS - Var. Costs | Contribution Margin = Revenue - Var. Costs |
Ultimately, whether you're selling software, sweaters, or services, the goal is the same: find a repeatable way to make each "unit" profitable. This table just shows that there's more than one path to get there.
Why Investors Are Obsessed with Unit Economics
When venture capitalists or private equity firms kick the tires on a potential deal, they aren't just swayed by a flashy pitch or impressive revenue figures. They're digging much deeper, hunting for cold, hard proof that the business model actually works. And nothing proves that more convincingly than strong unit economics.
To an investor, solid unit economics is the clearest signal of a healthy, scalable company. It’s evidence that the core engine of the business is sound. It shows that for every new customer you bring in, you're not just adding to the top line; you're generating real profit that can be reinvested to fuel even more growth. This is the ultimate sign of product-market fit and a well-run operation.
This perspective helps investors quickly separate “good growth” from “bad growth.” Good growth is profitable and builds long-term, sustainable value. Bad growth, on the other hand, is just a mirage. It's propped up by a broken model where a company is spending more to acquire a customer than that customer will ever be worth. This kind of growth is a bonfire for cash—and completely unsustainable.
The Bedrock of a Scalable Business
Let's be blunt: a business that loses money on every single customer can't scale its way to profitability. It's a common trap. Pouring more fuel (i.e., investor cash) on that fire just makes the losses grow bigger, faster. Investors know this all too well, which is why unit economics is a non-negotiable part of any serious evaluation.
During the due diligence phase, these numbers are put under a microscope to forecast the company's future financial health. You can see just how deep this process goes in our guide to venture capital due diligence. It's the moment where a startup's exciting story has to stand up to the unblinking reality of its finances.
"A company with strong unit economics has a license to grow. A company with weak unit economics is just asking for more money to burn. It’s that simple."
This relentless focus on per-unit profitability is why metrics like contribution margin are so vital. A positive contribution margin proves that each sale generates cash to help cover fixed costs and, eventually, turn a profit. Without it, the business model has a fundamental flaw.
Key Signals Investors Look For
Investors use unit economics to answer a few make-or-break questions about a company's health and potential. They’re looking for specific green flags that point to a capital-efficient and promising business.
-
A Healthy LTV to CAC Ratio: This is the big one. A ratio of 3:1 or better is widely considered the gold standard, showing a fantastic return on your customer acquisition spending. The CLTV:CAC ratio is often the first thing an investor will ask about, as it’s a powerful predictor of sustainable growth.
-
A Short Payback Period: How fast do you make your money back on a new customer? A shorter payback period—ideally under 12 months for a SaaS business—means you can recycle cash faster. This allows the business to fund its own growth instead of constantly relying on outside investment.
-
High Gross Margins: Healthy gross margins demonstrate pricing power and an efficient cost structure. This gives you a crucial buffer to absorb unexpected costs, handle competition, and invest in making your product even better.
At the end of the day, these metrics aren't just numbers on a spreadsheet; they are the direct result of your company's strategic choices. They reveal how well you understand your customers, manage your costs, and keep people coming back. For any founder looking to raise capital, mastering your unit economics isn't just a good idea—it's the price of admission. It’s the language investors speak.
A Framework for Analyzing Unit Economics
Knowing the theory is one thing. Applying it under pressure in a case interview or a high-stakes board meeting? That’s a completely different ballgame. To cut through the noise, you need a structured, repeatable process.
Think of this four-step framework as your mental checklist. It will help you break down any business model, get to the core of its profitability, and present your findings like you’ve been doing it for years.
Step 1: Clearly Define "The Unit"
First things first: what exactly is the "unit"? This might sound basic, but getting this wrong throws off every single calculation that follows. Is it one customer? A single monthly subscription? One transaction on a marketplace? One widget sold?
The answer defines the entire scope of your analysis. In a case interview, never assume. It's far better to ask a clarifying question like, "Just to make sure we're on the same page, are we looking at the economics of a single customer, or should we focus on the profitability of an individual order?" This shows you’re a sharp, precise thinker from the get-go.
Step 2: Map Out the Money In and Money Out
Once your unit is locked in, it's time to follow the money. Your goal is to map every dollar of revenue and every variable cost directly associated with that single unit.
Build a simple P&L for one unit:
- Revenue: What's the price? The subscription fee? The average order value?
- Variable Costs (COGS): What are the direct costs? Think raw materials, payment processing fees, shipping, or the sliver of customer support time tied directly to that unit.
The whole point here is to calculate the contribution margin per unit. If this number is positive, you’ve got a good first sign—it means each transaction is generating cash that can go towards paying for fixed costs like rent and salaries.
Step 3: Calculate the Key Health Metrics
With the foundational numbers sorted, you can now zoom out and calculate the metrics that reveal the true health of the business model. The two most powerful indicators are the LTV to CAC ratio and the payback period.
- LTV to CAC Ratio: This is the big one. You calculate the total lifetime value (LTV) of a customer and stack it up against the cost to acquire them (CAC). The magic number everyone looks for is a ratio of 3:1 or better. That's a classic benchmark for a sustainable, scalable business.
- Payback Period: This tells you how quickly you make your money back. How many months does it take to earn back the initial customer acquisition cost? For most subscription or recurring revenue businesses, a payback period under 12 months is a fantastic sign of capital efficiency.
These metrics elevate your analysis from a single transaction to the long-term viability of the company's entire growth engine. It's closely related to finding the company's overall breakeven point, a topic we cover in our guide to break-even analysis examples.
Step 4: Turn Your Numbers Into a Strategic Recommendation
Finally, you have to connect the dots. An analysis is useless if it doesn't lead to a clear, actionable recommendation. Based on everything you’ve uncovered, what should the business do next?
The essence of a strong recommendation is connecting the "what" (the unit economics results) with the "so what" (the strategic implication). It's not just about the numbers; it's about what the numbers mean for the company's future.
For instance, don't just state that the LTV:CAC ratio is a weak 1.5:1. Propose a solution. Frame it like this: "The current unit economics are unsustainable for aggressive growth. To fix this, we should prioritize two potential levers: first, focus on initiatives to increase customer retention by 15%, and second, test lower-cost acquisition channels like organic search to reduce CAC."
This approach transforms your analysis from a simple math exercise into a powerful, forward-looking strategic plan.
Common Unit Economics Mistakes to Avoid
Getting a handle on unit economics can give you a massive analytical edge, but it's easy to trip up. A few common missteps can lead to conclusions that are not just wrong, but dangerously misleading. To get it right, you have to be aware of the subtle traps that can paint a misleadingly rosy picture of a company's health.

One of the most frequent errors I see is a botched Lifetime Value (LTV) calculation. This almost always happens when people underestimate—or worse, completely ignore—customer churn. If your customers are leaving faster than you think, your LTV is going to be a fraction of what you've calculated, making your entire business model look far healthier than it is.
Another classic mistake is relying on a blended Customer Acquisition Cost (CAC). Lumping all your marketing channels into one average figure is a recipe for disaster because it hides the real story. Sure, your $50 blended CAC might look great on a slide. But it could be masking a highly profitable $10 CAC from organic search and an absolutely unsustainable $200 CAC from paid social ads. Without breaking it down, you're flying blind.
Misinterpreting Key Margins
It’s also critical to get your margins straight. A surprisingly common slip-up is confusing gross margin with contribution margin, and the difference is everything.
Gross margin only accounts for the direct Cost of Goods Sold (COGS). But the contribution margin is more honest—it subtracts all the variable costs tied to that specific sale, like shipping, handling, and payment processing fees.
Using the wrong one makes a unit seem far more profitable than it actually is on a per-transaction basis.
Finally, don't get hypnotized by a great LTV to CAC ratio. A fantastic ratio doesn't mean much if your payback period is painfully long. A business that takes 24 months to earn back what it spent to acquire a customer might look great on paper. In reality, it's facing a brutal cash flow crunch that could seriously stunt its growth or even sink the company.
Steering clear of these common pitfalls is what separates a surface-level analysis from a truly insightful one that drives smart decisions.
Common Questions About Unit Economics
When you start digging into unit economics, a few questions almost always pop up. Let's tackle some of the most common ones that come up in business analysis and especially in case interviews.
What Is a Good LTV to CAC Ratio?
For a healthy business, especially in SaaS, the gold standard is an LTV to CAC ratio of 3:1 or higher. Think of it this way: for every dollar you spend to get a customer, you should expect to get at least three dollars back in profit over their lifetime.
If your ratio dips below 1:1, you're in the danger zone—you’re literally paying more to get a customer than they're worth. On the flip side, a ratio above 5:1 is fantastic, but it might actually mean you're being too conservative with your marketing. You could probably spend more to grow faster and grab more of the market. Of course, the "perfect" ratio really depends on your industry, margins, and how much cash you have on hand.
How Do You Define the "Unit"?
The "unit" is simply the basic, repeatable thing you sell that makes you money. Picking the right unit is the foundation of your entire analysis.
- SaaS: The unit is almost always a single customer or subscription.
- E-commerce: It could be one customer, or you might analyze it as a single order.
- Marketplaces (like Uber): The unit is typically one transaction, like a single ride.
The trick is to choose the most fundamental building block of your business. Whenever you present an analysis, always start by stating exactly what "unit" you're using. It keeps everything clear and prevents confusion.
Can a Company Be Profitable with Bad Unit Economics?
Not for long. A company with bad unit economics—meaning it loses money on every customer it acquires—can't be profitable in a sustainable way. It might look profitable for a short time thanks to things like a large one-time project, but that just masks the underlying problem.
If the core business loses money on each unit, then growing the business just means losing money faster. This is exactly why investors and interviewers are so obsessed with unit economics. They're the best predictor of a company's real, long-term health and its ability to scale successfully.
Ready to master concepts like this for your next consulting or finance interview? Soreno is an AI-powered platform with over 500 cases and 80 guided drills to help you nail it. You get instant, rubric-based feedback and unlimited practice to build the confidence you need. Start your 7-day free trial.