What Is Profitability Analysis a Guide for Consultants
Master what is profitability analysis with our complete guide. Learn the frameworks, metrics, and step-by-step process to ace consulting case interviews.

Profitability analysis is how you figure out if a business is actually making money. It's a deep dive that goes way past just looking at revenue to see how efficiently a company turns its sales, assets, and equity into real, tangible profit.
Think of it as a financial health check-up. It helps you spot where the business is strong, where it's leaking cash, and what's really driving the bottom line.
A Guide to Profitability Analysis

So, what is profitability analysis in practice? It’s the tool that takes you from asking "Is the company bringing in cash?" to answering much smarter, more strategic questions:
- How well are we actually using our resources to make a profit?
- Which of our products, services, or even customer types are the true money-makers (and which are costing us)?
- Can our current pricing and cost models actually support long-term, healthy growth?
Let's use an analogy. Imagine a business is a high-performance engine. Revenue is just the fuel going in. That doesn't tell you a thing about how efficient the engine is. Profitability analysis is the diagnostic report that shows you exactly how much of that fuel turns into power (profit) and how much gets wasted as heat and friction (costs and inefficiencies).
The Core Components of Profitability
To really get a handle on a company’s financial story, you have to look at it from a few different angles. Each component of profitability analysis gives you a unique perspective. For example, profit margins tell you how much you make on each sale, while return on assets (ROA) shows you how good the company is at using what it owns to generate earnings.
Profitability analysis isn't just about crunching numbers; it's about telling the story behind them. A declining margin might point to rising material costs, intensifying competition, or an inefficient production process.
The process involves digging into financial statements to calculate key ratios and metrics. You then compare these numbers against past performance, industry averages, or your closest competitors to see where you stand. A company might be celebrating huge revenue growth, but a quick analysis could show that its customer acquisition costs are so high that it’s actually losing money on every new deal. It’s a classic case of a leaky bucket.
On the flip side, this kind of analysis can shine a light on a hidden gem—a product line with low sales volume but sky-high margins that's just begging for more investment.
Ultimately, a solid analysis arms you for better strategic decisions. You’ll know when it’s time to raise prices, where to cut costs, or when to pull the plug on an underperforming product. A huge piece of this puzzle is understanding the point where you stop losing money and start making it. For a deeper look at that, check out our guide on how to calculate the break-even point.
To help organize these concepts, here’s a quick summary of the fundamental pillars of profitability analysis.
Core Components of Profitability at a Glance
This table breaks down what each core component measures and why it’s so critical for understanding a business's financial health.
| Component | What It Measures | Why It's Important |
|---|---|---|
| Profit Margins | The percentage of revenue that becomes profit at different stages (gross, operating, net). | Reveals the core profitability of products, operational efficiency, and overall financial health after all expenses. |
| Return Metrics | The efficiency of using assets (ROA) or equity (ROE) to generate profit. | Shows how effectively the company is using its capital and investments to create value for stakeholders. |
| Break-Even Analysis | The sales volume needed to cover all fixed and variable costs, resulting in zero profit. | Determines the minimum performance required to avoid losses and helps in setting sales targets and pricing. |
Each of these pillars provides a vital piece of information, and together, they paint a complete picture of a company's ability to generate and sustain profit.
Why This Skill Is Your Key to Case Interviews
Profitability analysis isn't some abstract concept you'll only find in a textbook. It's the core language of consulting and finance case interviews. When an interviewer from a top-tier firm kicks things off with, "Our client's profits are down," they aren't just stating a problem. They're teeing up a test to see how you think.
This one, seemingly simple prompt is designed to measure your structured thinking, business instincts, and comfort with numbers all at once. It’s your moment to show you can do more than just rattle off formulas. You have to prove you can think like a strategist, breaking a messy business problem down into its fundamental building blocks: revenues and costs.
A Test of Structured Problem Solving
Think of a profitability case as a puzzle with most of the pieces missing. The interviewer wants to see if you can build a logical framework—often called a "profitability tree"—to find those missing pieces systematically. Can you break down revenue into its drivers, like price per unit and the number of units sold? Can you slice up costs into what’s fixed and what’s variable?
This structured approach is what keeps you from jumping to wild conclusions. Instead of just guessing, you're methodically investigating potential weak spots, whether they're in the company's pricing strategy, its cost structure, its mix of products, or even a shift in the market itself. It shows you can handle ambiguity with a clear, logical plan.
Mastering profitability analysis proves to an interviewer that you can take a vague, high-level problem and turn it into a series of specific, answerable questions. That skill is the very definition of what a consultant gets paid to do.
This framework becomes your roadmap for the entire case. It tells you what questions to ask, helps you decide what data you need, and ensures your final recommendation is built on a solid foundation of evidence-based diagnosis.
Beyond the Numbers: Showing Off Your Business Acumen
While the math has to be right, a truly great candidate knows the numbers are just the beginning. Profitability analysis tells a story. A drop in profit isn't just a percentage on a spreadsheet; it's a symptom of something bigger going on in the business.
Is a new competitor stealing market share? Are the costs of raw materials suddenly squeezing margins? Did a flashy marketing campaign drive up acquisition costs without bringing in enough new sales? Your ability to connect the quantitative findings to these real-world business scenarios is what separates a good answer from a great one. This is where your business smarts really come into play.
It's also crucial to understand the broader economic context. For instance, global profit rates have been in a striking long-term decline for the last six decades. From 1960 to 2019, the world profit rate fell at an average annual rate of -0.24%, mostly because the output-capital ratio was falling. Knowing about macro trends like this allows you to add another layer of depth to your analysis, showing that you can spot external factors that might be dragging a company down. You can dig into the full research about these profitability trends to learn more.
Ultimately, getting a firm grip on profitability analysis is non-negotiable if you're serious about a career in consulting or finance. It’s the single best way to demonstrate the exact skills these firms prize most: clear logic, sharp analytical abilities, and the insight to deliver recommendations that actually create value.
Mastering the Essential Profitability Frameworks
So, how do you actually figure out if a business is making money? It all boils down to one simple, universal truth: Profits = Revenue - Costs.
But that's just the start. Think of that formula as the trunk of a massive tree. To truly understand a company's health, you have to explore its branches—the specific metrics and frameworks that reveal the full story.
When a doctor checks your health, they don’t just take your temperature; they look at your heart rate, blood pressure, and more. It’s the same with business. You need a set of vital signs to diagnose what’s really going on.
The Story Profit Margins Tell
Profit margins are the quickest way to get a pulse on a company’s financial health. They’re percentages that show how much of each dollar in sales a company actually keeps after paying for things. You absolutely have to know the big three.
-
Gross Profit Margin: This tells you if the core business model works. After you sell a product, how much cash is left over after paying for the direct costs of making it (often called Cost of Goods Sold, or COGS)? A healthy gross margin means you’re making money on each sale, before any overhead.
-
Operating Profit Margin: This metric goes a little deeper. It shows what's left after you subtract both COGS and all the day-to-day operating expenses—things like marketing, salaries, and rent. It’s a fantastic gauge of how efficiently the company is run.
-
Net Profit Margin: This is the famous "bottom line." It’s the final slice of the pie, showing what percentage of revenue is left after every single expense—including taxes and interest on debt—has been paid. This is the ultimate measure of profitability.
These margins paint a picture. A company might have a stellar gross margin, but if its operating margin is razor-thin, you know there's a problem with overhead. Maybe they're spending way too much on marketing or have a bloated administrative staff. That's the kind of insight that moves you from just crunching numbers to thinking like a strategist.
Comparing Key Profitability Metrics
To keep these straight, it helps to see them side-by-side. Each metric offers a unique lens into a company's performance, from its core product profitability to its overall operational efficiency.
| Metric | Formula | What It Tells You |
|---|---|---|
| Gross Profit Margin | (Revenue - COGS) / Revenue | How profitable the company's core products or services are on their own. |
| Operating Profit Margin | (Revenue - COGS - Operating Expenses) / Revenue | How efficiently the company manages its day-to-day operations. |
| Net Profit Margin | (Net Income) / Revenue | The final "bottom line" profitability after all expenses, including taxes and interest. |
| Return on Assets (ROA) | Net Income / Total Assets | How well the company uses its assets to generate profit. |
| Return on Equity (ROE) | Net Income / Shareholder Equity | The rate of return generated for the owners' investment. |
This table isn't just a cheat sheet; it's a diagnostic toolkit. By comparing these metrics, you can quickly pinpoint where a business is excelling and where it's falling short.
Building Your Profitability Tree
In a case interview or a real-world business problem, you can't just stare at the Profits = Revenue - Costs formula. You have to break it down into a structured framework—often called a profitability tree—to systematically find the root of the problem.
Here’s a simple way to build one:
- Revenue: The first major branch is always revenue. This splits into its fundamental drivers:
Price per Unit x Quantity Sold. You can then get more granular, segmenting quantity by product, region, or customer type to see exactly where sales are coming from. - Costs: The other major branch is costs. This almost always splits into
Fixed Costs(the stuff you pay for no matter what, like rent) andVariable Costs(the costs that go up as you produce more, like raw materials). Variable costs can be broken down further intoCost per Unit x Quantity Sold.
This structure is your best friend. It stops you from just randomly guessing at solutions and gives you a logical roadmap. You can follow each path, ask smart questions, and isolate the real issue causing profits to drop.
A profitability framework isn't a rigid checklist; it's a flexible map. It guides your investigation, helping you explore different paths (like pricing, sales volume, or cost structure) to find where the treasure—or the problem—is buried.
Context matters, too. Historical data shows that average gross profit margins hover around 36.56% and net margins are about 8.54%, but these numbers swing wildly between industries. Banks and oil companies can hit net margins over 28%, while a hyper-competitive field like auto manufacturing might scrape by with just 3.53%. Knowing these benchmarks helps you understand if a company’s performance is a true outlier or just par for the course.
Going Beyond Margins to Measure Efficiency
Margins are critical, but they don't give you the complete picture. You also need to know how efficiently a company is using its resources to make those profits. That’s where return metrics come into play.
- Return on Assets (ROA): This tells you how good a company is at using its stuff—cash, inventory, factories, equipment—to generate profit. The question it answers is, "For every dollar we have tied up in assets, how many cents of profit are we squeezing out?"
- Return on Equity (ROE): This one is huge for investors. It measures the profit generated as a percentage of the money shareholders have invested in the business. For industries like banking, Mastering Return on Equity is a vital framework for understanding performance from an owner's perspective.
These frameworks are your lens for viewing any business. Once you know how to break profit down into its core drivers and measure its efficiency, you can stop just finding problems and start strategically solving them.
For a deeper dive into how this plays out on a per-product basis, our guide on what is unit economics is the perfect next step.
A Step-by-Step Profitability Case Walkthrough
Theory is your map, but a real-world case interview is the journey. Let’s put all this into practice. Imagine you're in an interview, and the consultant slides a piece of paper across the table with this prompt:
"Our client is ‘The Daily Grind,’ a national coffee shop chain. For the past three years, profits grew steadily at 5% annually. But over the last 12 months, overall profits have unexpectedly dropped by 10%. Your job is to figure out why and tell them what to do about it."
This is a classic profitability case. Before you start throwing out ideas, your very first move should be to structure the problem. The beautifully simple equation of Profit = Revenue - Costs is the backbone of your entire analysis.
This visual shows how revenue and costs flow into profit—the heart of our investigation. By breaking the problem down this way, we can systematically hunt for the root cause without missing anything.
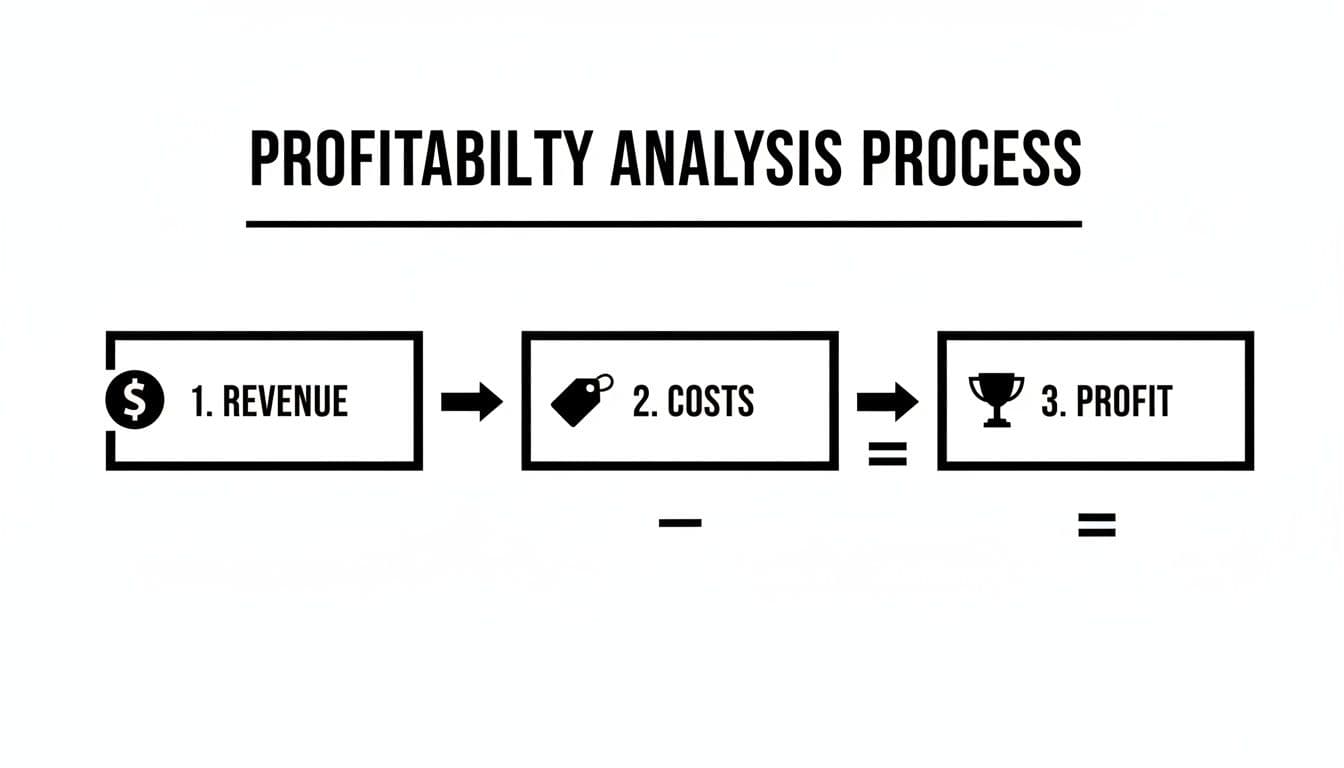
This isn't just a formula; it's your diagnostic toolkit. It guides your questions and keeps your thinking sharp and organized.
Step 1: Structure the Problem and Ask Clarifying Questions
First, you need to talk the interviewer through your framework. You’re essentially building your profitability tree out loud, showing them right from the start that you think in a logical, structured way.
You might say: "To get to the bottom of this 10% profit drop, I’d like to break the problem down into its two core drivers: revenue and costs. On the revenue side, I want to look at the number of cups sold and the average price per cup. On the cost side, I'll investigate both variable costs—things like coffee beans and milk—and fixed costs, like rent and staff salaries. Does that sound like a good place to start?"
Once the interviewer gives you the green light, it's time to ask for the data you need to start digging.
- "You mentioned a 10% drop in overall profit. Can you give me the actual profit figures for last year and this year?"
- "Is this decline happening across the board, or is it concentrated in specific areas, like our urban stores versus suburban ones?"
- "Have there been any major shifts in our product mix? For example, are we selling more low-margin drip coffee and fewer high-margin specialty lattes?"
These questions show you’re not just reciting a script; you're actively hunting for clues.
Step 2: Segment the Data and Form a Hypothesis
The interviewer provides some numbers. Let’s say profit last year was $50 million and this year it’s $45 million, which confirms the 10% drop. They also mention the decline is nationwide, not tied to a specific region.
Now it’s time to dig into the main branches of your framework: revenue and costs.
You ask: "Could you break down the revenue and cost numbers for both years?"
The interviewer shares this table:
| Metric | Last Year | This Year | Change |
|---|---|---|---|
| Total Revenue | $250M | $250M | 0% |
| Total Costs | $200M | $205M | +2.5% |
| Total Profit | $50M | $45M | -10% |
Boom. This is a massive insight. Revenue is completely flat, meaning the entire profit decline is coming from a $5 million increase in costs. Your investigation just narrowed significantly.
Now you can form a sharp hypothesis: The profit decline is driven exclusively by rising costs.
Step 3: Drill Down into the Root Cause
With a clear hypothesis, it's time to follow the money. You need to dissect the cost side of your profitability tree and figure out if the issue is with fixed costs or variable costs. If you need a refresher on this critical distinction, you can explore this guide on how to find variable cost.
You ask: "Since the entire problem seems to be on the cost side, could we break down that $205 million into fixed and variable components for this year and last?"
The interviewer gives you the next layer of detail:
| Cost Type | Last Year | This Year | Change |
|---|---|---|---|
| Variable Costs | $120M | $120M | 0% |
| Fixed Costs | $80M | $85M | +6.25% |
| Total Costs | $200M | $205M | +2.5% |
There it is. You've pinpointed the exact source of the problem. Variable costs are unchanged, but fixed costs have shot up by $5 million.
The final step is to ask why. A simple question about the breakdown of those fixed costs might reveal that the company launched a major new marketing campaign this year, with a budget of exactly $5 million.
Step 4: Synthesize and Recommend a Solution
You've found the culprit. Now, you have to bring it all together in a clear, actionable recommendation. Don't just state what happened; propose a smart way forward.
You conclude: "My analysis shows that The Daily Grind's 10% profit drop was caused entirely by a $5 million increase in fixed costs, which traces back to a new national marketing campaign. While revenue held steady at $250 million, this new expense directly cut profits from $50 million to $45 million. The campaign failed to generate any incremental revenue to offset its cost, giving it a negative return on investment."
From there, you transition smoothly to your recommendations.
- Recommendation: "I recommend the client immediately review the marketing campaign's performance. If it isn't projected to drive enough future revenue growth to cover its costs, they should seriously consider discontinuing it or reallocating that budget to more effective initiatives."
- Next Steps: "As a follow-up, I would analyze the campaign's impact on softer metrics like customer traffic and brand awareness to see if there are any hidden, non-revenue benefits. I would also benchmark our marketing spend against competitors to see if we're out of line with the industry."
This structure—question, analyze, and recommend—is how you turn a broad, messy problem into a sharp, data-driven solution. It’s the essence of great profitability analysis.
Common Mistakes and How to Avoid Them

Even the sharpest candidates can get tripped up in a high-stakes profitability case. The pressure of the interview room has a way of turning simple challenges into major hurdles.
Knowing the common traps is the first step toward sidestepping them. It's not about memorizing frameworks; it’s about applying them with surgical precision when the clock is ticking. By building solid habits, you can make sure your analysis is not just correct, but truly impressive.
Mistake 1: Overlooking Problem Segmentation
One of the most common blunders is failing to break the problem down. A candidate might see revenue is down and jump to vague, sweeping guesses like "it must be the economy" or "a new competitor showed up."
- What Not To Do: "Profits are down. Maybe we should run a marketing campaign?"
- What To Do Instead: "To really understand this revenue dip, I'd like to segment our sales. Can we look at the breakdown by product line, customer type, and geographic region over the past two years?"
This simple shift turns a fuzzy problem into a focused investigation. It lets you zero in on the exact source of the bleed instead of wasting time chasing dead ends.
Mistake 2: Delivering Generic Recommendations
After all the hard analytical work, it’s surprisingly easy to fall at the last hurdle with generic advice. Telling a company to "reduce costs" or "increase marketing" is essentially useless without concrete, data-driven specifics. Your recommendation has to be a direct answer to the root cause you unearthed.
A great analysis that ends with a weak recommendation is like a perfectly constructed joke with no punchline. The final synthesis is what gives your work its ultimate impact and value.
Always tie your solution back to the numbers. If you discovered that one specific, high-cost ingredient was killing your margins, your recommendation isn't a bland "cut expenses." It's a targeted plan to renegotiate with that supplier or find a cheaper material.
Mistake 3: Ignoring the Bigger Picture
It’s crucial to connect your case analysis to the wider market forces at play. For instance, a deep dive into equity markets reveals that margin expansion has been a primary driver of investor returns for decades, especially in developed economies.
For anyone using Soreno to practice M&A cases, this context is non-negotiable. Factors like stagnant wages, globalization's impact on labor costs, lower corporate taxes, and relaxed antitrust enforcement have shaped the corporate landscape. You can explore more about these historical margin shifts to see just how much macroeconomic trends can influence a single company's bottom line.
Mistake 4: Making Calculation Errors Under Pressure
Nothing derails a great case performance faster than a simple math error. Rushing through calculations or trying to do it all in your head is just asking for trouble.
Here’s how to stay on track:
- Talk it out. Announce your calculations as you do them. Talking the interviewer through your steps ("First, I’ll calculate the total variable cost by multiplying the cost per unit by the number of units sold…") lets them follow your logic and even jump in to correct a minor slip.
- Write it down. Use the paper they give you. Lay out your math neatly so you can track your work and spot potential mistakes before they happen.
- Round smartly. When precision isn't critical, use round numbers to get a quick estimate. Just be sure to state your assumption clearly ("To get a quick feel for the impact, I'm going to round the price up to $10…").
Avoiding these common pitfalls helps you move past simply "solving the case" and into the territory of demonstrating the structured, insightful thinking that top firms are really looking for.
Frequently Asked Questions
As you get ready for your interviews, a few common questions about profitability cases tend to surface again and again. Let's tackle them head-on so you can walk into your next case interview with confidence.
We'll clear up:
- The real difference between a profitability case and a market sizing case.
- How to adapt your analysis for different industries.
- Simple, practical ways to get faster and more accurate with your case math.
How Is a Profitability Case Different from Market Sizing?
This is a great question. While both case types test your quantitative and logical thinking, they're fundamentally asking different things.
A market sizing case is all about the big picture, asking, "Just how big is this opportunity?" You're essentially building a logical estimate of potential revenue to gauge the size of a market. It's an estimation game.
A profitability case, on the other hand, is a diagnostic deep-dive. It asks, "Why is this specific company losing money or not making enough?" You’re not just looking at revenue; you’re dissecting the entire profit formula (Profit = Revenue – Costs) to pinpoint the root cause of a business problem. Market size might be part of the revenue story, but the core task is to find what’s broken internally.
What Industry-Specific Factors Should I Consider?
This is where you can really shine and show you're thinking beyond a generic framework. A one-size-fits-all approach to profitability just doesn't work in the real world, and interviewers know it. The levers that drive profit look completely different from one industry to the next.
For instance:
- In Tech (especially SaaS), the conversation will likely revolve around unit economics. Think Customer Lifetime Value (LTV) versus Customer Acquisition Cost (CAC).
- For a Retail company, you'd want to look at metrics like sales per square foot, inventory turnover, and same-store sales growth.
- In Manufacturing, your focus might shift to things like factory utilization rates, the fluctuating cost of raw materials, and overall supply chain efficiency.
Always kick off your analysis by asking yourself: "What truly drives value and creates costs in this particular industry?" This small step transforms your analysis from a simple calculation into a genuine strategic assessment.
How Can I Improve My Math Speed and Accuracy?
It's completely normal to feel a bit of pressure when doing math on the spot. But the goal isn't to be a human calculator—it's to be systematic and clear-headed to avoid simple mistakes. For other general interview tips, some platforms have their own frequently asked questions that can be helpful.
Here are a few techniques that truly make a difference:
- Estimate First. Before you start multiplying exact numbers, do a quick "back-of-the-envelope" calculation with rounded figures. This gives you a ballpark answer and helps you immediately spot if your final, precise calculation is way off.
- Talk Through Your Steps. Verbalize your math as you do it. Saying "Okay, now I'm multiplying the 2.1M units by the $4.50 price per unit..." not only helps you catch your own errors but also lets the interviewer follow your logic. If you make a mistake, they can often gently course-correct you.
- Write It Down Clearly. Don't try to juggle complex calculations in your head. Use the paper you're given to lay out your math neatly. Label your steps. This creates an easy-to-follow trail for both you and the interviewer, drastically reducing the chance of a silly slip-up.
Ready to stop just reading about cases and start mastering them? Soreno provides an AI-powered practice platform with an extensive library of profitability drills and real-world cases. Get instant, rubric-based feedback on your structure, communication, and business insights to turn theory into interview-winning performance. Start your free trial today at https://soreno.ai.