How to Build Financial Models That Win Interviews
A practical guide on how to build financial models from scratch. Learn to master the three-statement model, DCF, and LBOs with real-world examples.

Before you can even think about building a complex DCF or LBO model, you have to master the fundamentals. And in financial modeling, the absolute bedrock is the three-statement model. Everything starts here.
The goal isn't just to lay out an income statement, balance sheet, and cash flow statement side-by-side. The real power comes from making them dynamically linked. When you build it right, a change to a single assumption—say, revenue growth—should ripple through all three statements automatically. That's how you create a living, breathing analytical tool instead of a static spreadsheet.
Mastering the Three-Statement Model
Think of the three-statement model as the engine of your entire analysis. It powers everything else. A valuation, a scenario analysis, an LBO model—they are all built on top of this core structure. If your three statements don't talk to each other correctly, any analysis you build on top will be fundamentally flawed.
It's like building a house. You wouldn't put up walls on a shaky foundation. In the same way, you can't build a credible valuation on a disconnected set of financial statements. The entire point is to create an integrated system where the income statement, balance sheet, and cash flow statement are in constant communication.
This diagram shows how everything flows together. It’s a great visual to keep in mind as you build.
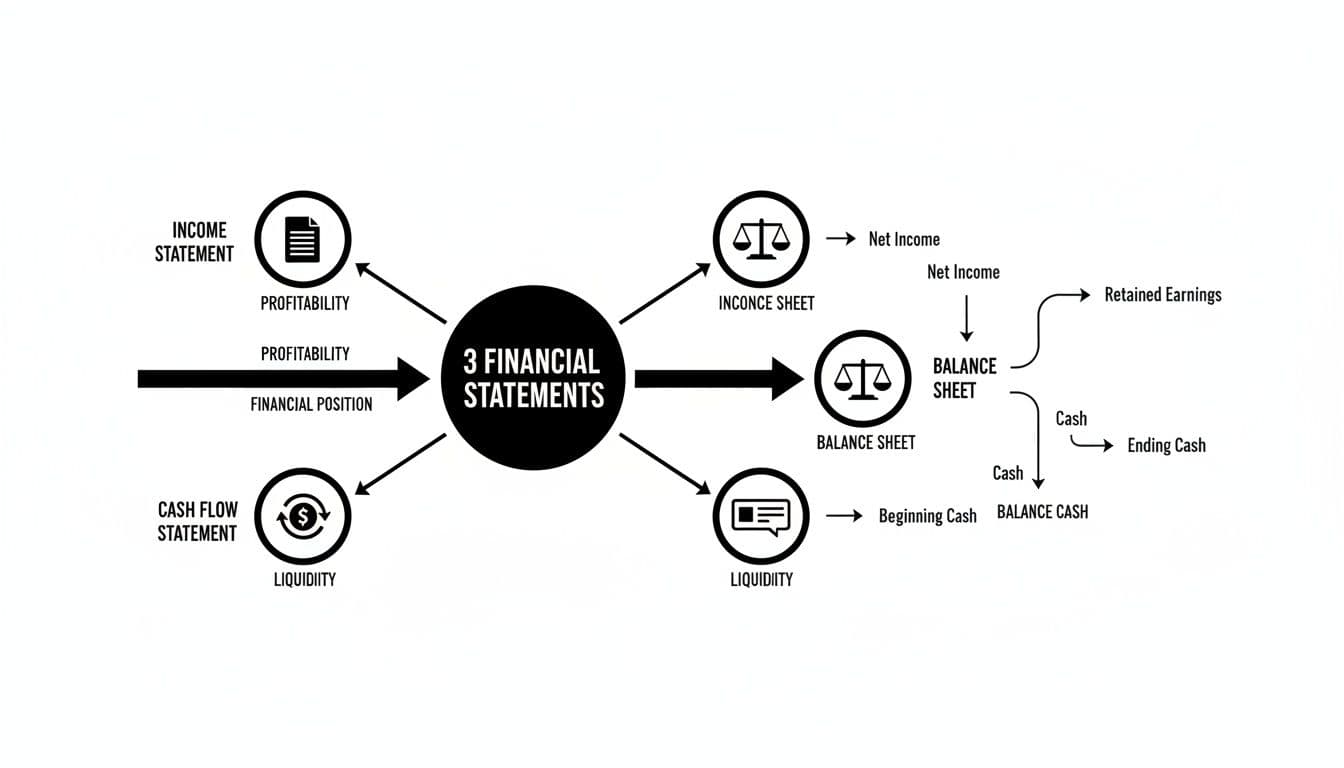
As you can see, Net Income from the income statement is a critical input for both the cash flow statement and the balance sheet. These are the kinds of essential links that make a model dynamic.
From Historical Data to a Dynamic Forecast
The first practical step is always to gather historical data. You'll want the last three to five years of the company's financials to serve as your baseline. This historical context is what allows you to make reasonable, defensible assumptions about the future.
Get your Excel workbook set up for success from the start. A clean layout is non-negotiable. I always separate historical data, my core assumptions, and the forecasted model into different sheets.
Here's a pro tip that will save you headaches later: use color-coding. The industry standard is blue font for hard-coded inputs and black font for formulas. This simple habit makes your model infinitely easier to read, debug, and for others to audit.
With your historicals laid out, it's time to build the supporting schedules. These are the smaller, focused models that drive the main forecast. You absolutely need to build these out before touching the three main statements.
The most important schedules are:
- Depreciation Schedule: Tracks your Property, Plant & Equipment (PP&E) balance, accounts for new capital expenditures (CapEx), and projects future depreciation.
- Working Capital Schedule: Forecasts the changes in current assets (like Accounts Receivable) and current liabilities (like Accounts Payable) to see how they impact cash.
- Debt and Interest Schedule: This maps out all existing and new debt, tracks repayments, and calculates the interest expense that will hit your income statement.
Linking the Statements Together
This is where the model truly comes to life. Once the supporting schedules are done, you can start weaving the three core statements together. It's a satisfying process when it clicks.
For instance, Net Income from the bottom of your income statement is the very first line item in the Cash Flow from Operations section of your cash flow statement.
A classic rookie mistake is messing up the Retained Earnings link. It’s a crucial plug for the balance sheet. Always remember the formula: Previous Period's Retained Earnings + Current Period's Net Income - Dividends. Get this wrong, and your model will never balance.
The Depreciation Expense you calculated in its schedule does double duty: it hits the income statement as an expense and is also added back on the cash flow statement (since it's a non-cash charge). Likewise, the Ending Debt Balance from your debt schedule is what populates the debt line item on your balance sheet.
The moment of truth comes when you link the Ending Cash Balance from the bottom of your cash flow statement back to the cash line item on the current period’s balance sheet. If your logic and links are all correct, your balance sheet will balance: Total Assets = Total Liabilities + Equity.
I always build a "balance check" at the bottom of the balance sheet (Assets - Liabilities - Equity). This formula should equal zero for every single period in your forecast. If it doesn't, you've got to go back and audit your links.
To get a much deeper look into the mechanics, you can learn more about how to analyze financial statements in our detailed guide. Getting this integration right is what transforms your spreadsheet from a simple data repository into a powerful forecasting machine.
Core Components of an Integrated Financial Model
Here’s a quick-reference table summarizing the purpose of each core statement within the model and the key items you'll be forecasting.
| Statement | Primary Purpose | Key Line Items to Forecast |
|---|---|---|
| Income Statement | Shows the company's profitability over a specific period (e.g., a quarter or a year). | Revenue, COGS, SG&A, Interest Expense, Taxes, Net Income |
| Balance Sheet | Provides a snapshot of the company's assets, liabilities, and equity at a single point in time. | Accounts Receivable, Inventory, PP&E, Accounts Payable, Debt, Retained Earnings |
| Cash Flow Statement | Reconciles Net Income to the actual change in cash over the period, categorized into operating, investing, and financing activities. | Depreciation, Changes in Working Capital, CapEx, Debt Repayments, Dividends |
Ultimately, each statement tells a different part of the company's story, but it’s how they connect and interact that gives you the full picture.
Developing Assumptions That Drive Your Model

Let's be clear: a financial model without solid, well-researched assumptions is just a fancy calculator. The math is the easy part. It’s the story and the logic behind the numbers that give a model its power and credibility. This is where you graduate from being a spreadsheet jockey to a strategic thinker.
Every single forecast, from revenue growth to operating margins, needs to be grounded in a defensible narrative. Why are you projecting 8% growth next year instead of 6%? What market trends or company-specific initiatives support your assumption of decreasing costs? Answering these questions is the real work of building a robust financial model.
Grounding Forecasts in Historical Performance
Your journey into the future always starts by looking back. Historical data isn't just a set of numbers to plug in; it's the company's financial DNA. You absolutely need to analyze at least three to five years of performance to spot trends, understand seasonality, and calculate the key ratios that drove the business.
For example, dig into the relationship between revenue and the cost of goods sold (COGS). Has the gross margin been consistent, or is it trending up or down? Calculate historical averages for metrics like SG&A as a percentage of sales or Days Sales Outstanding (DSO). These historical figures are your first, most logical baseline for the forecast.
The most defensible assumption is one that extends a stable, observable trend. But the biggest mistake you can make is blindly extrapolating the past without asking why that trend exists and if it's actually likely to continue.
Looking Beyond the Company's Walls
Historical data gives you context, but the future is rarely a perfect mirror of the past. To build a truly forward-looking model, you have to look outside the company and incorporate external factors. This is what separates a student project from a professional-grade analysis.
Your research needs to pull from a few key places:
- Industry Reports: Publications from firms like Gartner or IBISWorld are gold mines for market size, growth rates, and competitive dynamics.
- Competitor Analysis: Get your hands on the public filings (10-Ks, 10-Qs) of key competitors. How are their margins trending? What are they spending on capex? This is the ultimate sanity check for your own assumptions.
- Economic Indicators: You can't ignore the big picture. Projected GDP growth, inflation, and interest rate forecasts will directly impact almost every company's performance.
This is exactly the kind of commercial awareness that gets tested in high-stakes interviews. There's a reason the global financial modeling and valuation market is projected to soar from USD 229.94 million in 2021 to an estimated USD 758.12 million by 2033—it's all driven by the intense demand for precise forecasting. You can explore more about this trend and its industry impact.
Documenting and Structuring Your Assumptions
This is non-negotiable: never bury your assumptions inside formulas. It's a rookie mistake that makes your model a nightmare to audit, understand, or adjust. The best practice is to create a dedicated "Assumptions" or "Drivers" tab where every key input is laid out in plain sight.
This is the home for all your primary drivers:
- Revenue Growth Rates (YoY)
- Gross Margin %
- SG&A as a % of Revenue
- Effective Tax Rate
- Capital Expenditures as a % of Revenue
- Key Working Capital Metrics (DSO, DPO, DIO)
Next to each assumption, add a short, clear note explaining where it came from. For instance, your revenue growth line might have a comment like: "Based on 5-year historical CAGR of 6.5%, adjusted to 8.0% to reflect new product launch discussed in Q4 investor presentation." This documentation turns your model from an intimidating black box into a persuasive analytical tool—a habit you must build if you're serious about learning how to build financial models professionally.
Building DCF and LBO Valuation Models
You've built a solid three-statement model—that's the engine. Now it's time to build the rest of the car and answer the big question: what is this company actually worth? This is where valuation modeling comes in, and the two heavy-hitters you need to master are the Discounted Cash Flow (DCF) and the Leveraged Buyout (LBO).
While both models are designed to pin a value on a company, they come at it from completely different angles. A DCF is all about finding a company's intrinsic value based on the future cash it's expected to generate. An LBO, on the other hand, looks at value from a private equity investor's perspective, focusing on the returns they can squeeze out by loading the company up with debt to buy it.
Unlocking Intrinsic Value with a DCF Model
The idea behind a DCF is actually pretty simple. A company's value today is just the sum of all the cash it will produce in the future, with each year's cash flow discounted back to what it's worth in today's dollars. It’s a bedrock valuation method you'll see used everywhere, from equity research reports to internal corporate strategy decks.
First, you need to project the company's Unlevered Free Cash Flow (UFCF). Think of this as the pure, raw cash the business generates before any debt payments. It's the cash available to all investors, both debt and equity holders. You'll get to this number by starting with your projected EBIT, applying a tax rate, adding back non-cash expenses like D&A, and then adjusting for investments in working capital and CapEx.
Next comes the discount rate, known as the Weighted Average Cost of Capital (WACC). The WACC is simply the blended cost of a company's financing from both debt and equity, and it reflects the overall risk of investing in that business. The higher the risk, the higher the WACC, and the less those future cash flows are worth today.
The last big piece is the Terminal Value (TV). You can't forecast cash flows out to infinity, so the TV is a way of estimating the company's value for all the years beyond your explicit forecast period (usually 5-10 years). There are two main ways to do this:
- Perpetuity Growth Method: You assume the company’s cash flows grow at a slow, steady rate forever.
- Exit Multiple Method: You assume the company gets sold at the end of the forecast, valuing it based on a multiple of its final year's EBITDA.
Once you have your UFCF projections, WACC, and Terminal Value, you just discount everything back to the present and add it all up. The result is the company's Enterprise Value.
The two inputs that will get grilled the most in any DCF review are the discount rate and the terminal growth rate. A tiny tweak of 0.5% to either of these can swing your final valuation by millions. This is why being able to defend your assumptions is just as important as the math itself.
Modeling a Private Equity Deal with an LBO Model
An LBO model is a different beast entirely. It's not trying to find some universal "true" value. Instead, it's a tool for figuring out the maximum price a private equity firm could pay for a company while still hitting its target return, which is usually an Internal Rate of Return (IRR) in the 20-30% range.
You'll start by building a "Sources and Uses" table. This is a simple but critical schedule that lays out where all the money to buy the company is coming from (the Sources, like sponsor equity and different layers of debt) and what it's all being spent on (the Uses, like buying the stock and paying banker fees).
From there, you'll use your three-statement model to project the company’s performance over the PE firm's hold period, typically five to seven years. The heart of an LBO model is the debt schedule. A huge part of the value creation comes from using the company's own cash flow to aggressively pay down the debt used to buy it.
At the end of the investment horizon, you calculate an exit value—usually based on an EBITDA multiple similar to the entry multiple. Finally, you map out the cash flows back to the PE sponsor and solve for the IRR. This tells you the annualized return the firm would make on its cash investment.
These modeling skills are absolutely essential in fields like technology investment banking, where DCF and LBO models are the bread and butter of M&A and capital raising deals.
Navigating the High-Stakes Interview Environment
Imagine you're in a private equity interview, getting grilled on your valuation of a tech company. The pressure is on. The demand for people who can do this work has exploded—the financial modeling market is expected to grow at a blistering 11.8% CAGR through 2030, and LinkedIn has shown demand for these skills has shot up 60% since 2020. In this kind of environment, just knowing the steps isn't enough; you have to truly own your model.
Being able to walk an interviewer through your DCF assumptions or explain how your LBO debt waterfall works is a non-negotiable skill. They aren't just testing your Excel shortcuts. They're probing your commercial instincts and your ability to think like an owner. To get ready for those tough questions, check out our guide on common finance interview questions and answers and make sure you're prepared.
Stress-Testing Your Model With Scenario Analysis
A financial model built for a single, perfect future—the "base case"—is brittle. The real world is messy, and a truly powerful model doesn't just give you one answer. It shows you a full spectrum of potential outcomes, preparing you for volatility and demonstrating real commercial acumen.
This is where you stress-test your assumptions with sensitivity and scenario analysis. It's what transforms your model from a static forecast into a dynamic strategic tool. And frankly, it’s what interviewers at top firms are looking for. They don’t just want to see if you can link the statements; they want to know if you understand risk, opportunity, and the key levers that truly drive a business.

Isolating Key Drivers With Sensitivity Analysis
Before building out full-blown scenarios, it's incredibly useful to isolate the one or two assumptions that have the biggest impact on your final valuation or key metric, like IRR or EPS. This is sensitivity analysis. You’re simply asking, "How much does my answer change if revenue growth is 1% higher or lower?"
Excel's Data Tables are your best friend here. A classic approach is a two-variable data table that shows how your company's Enterprise Value (the output) changes based on a range of inputs for two key drivers.
Common drivers to test include:
- Revenue Growth Rate: This is almost always the most sensitive assumption.
- EBITDA Margin: A small change in profitability can have a huge impact on cash flow.
- Terminal Growth Rate or Exit Multiple: In a DCF, these will dramatically swing your valuation.
- Weighted Average Cost of Capital (WACC): The discount rate is another highly sensitive input.
Creating a "football field" chart from this data is standard practice in investment banking presentations. It’s a highly effective way to visually present the range of potential valuations.
Building Comprehensive Scenarios
While sensitivity analysis tweaks one or two variables at a time, scenario analysis changes a whole set of assumptions simultaneously to model a completely different version of the future. This is how you build out your "Base," "Upside," and "Downside" cases.
The key is to create a logical narrative for each scenario. A "Downside Case," for instance, wouldn't just have lower revenue growth. It would likely also suffer from compressed margins due to competitive pressure and perhaps even higher working capital needs as customers start paying more slowly.
Pro Tip: The secret to building scenarios efficiently is using a toggle switch. Create a single input cell at the top of your assumptions sheet (e.g., cell B1). Then, use Excel's
CHOOSEfunction to drive all your key assumptions. If B1 is set to 1, all assumptions pull from the "Downside" column; if it's 2, they pull from the "Base Case," and so on. This allows you to flip the entire model between scenarios instantly.
The ability to build flexible, scenario-driven models is becoming even more critical. Imagine you're in a strategy case interview where your model needs to adapt to new information on the fly. As automation and AI transform finance, analysts are freed up for this higher-level strategic thinking. In fact, Accenture predicts that by 2025, 65% of repetitive modeling tasks will be automated, and AI adoption in financial institutions is expected to hit 85%.
By layering AI for predictive analytics, modern models can even forecast revenues with 20-30% accuracy gains. To stay ahead of the curve, it's worth learning about the impact of AI on financial modeling.
Presenting Your Findings
Ultimately, your analysis is only as good as your ability to communicate it. Don't just show the different valuation numbers; explain the story behind them.
To make your conclusions clear and compelling, create a summary table that lays out the key assumptions and outputs for each scenario.
Scenario Analysis Framework Example
Here is a simple framework illustrating how different assumptions for key drivers can be used to build your Base, Upside, and Downside cases. Notice how the inputs logically connect to create a consistent narrative for each potential future.
| Driver | Downside Case | Base Case | Upside Case |
|---|---|---|---|
| Revenue Growth (Year 1) | 2.0% | 5.0% | 8.0% |
| EBITDA Margin | 15.0% | 17.5% | 19.0% |
| Exit Multiple | 7.0x | 8.0x | 9.0x |
| Implied Equity Value | $450M | $575M | $720M |
This kind of structured output, combined with compelling charts, demonstrates that you're not just a number cruncher. It shows you're a strategic thinker who understands how to build financial models to navigate uncertainty and drive real-world business decisions.
Formatting Your Model For Professional Clarity
In a high-stakes finance interview, getting the numbers right is just the price of admission. What really sets you apart is a model that's clean, intuitive, and easy for someone else to pick up and understand.
Let's be real: your interviewer has maybe ten minutes to look at your work. If your spreadsheet is a chaotic mess of numbers, it screams messy thinking. A professionally formatted model, on the other hand, signals discipline, attention to detail, and frankly, respect for their time.
Think of it this way: your model is a communication tool first and a calculator second. Its job is to tell a clear financial story. If an analyst can't instantly find your key drivers or trace your logic, the brilliance of your analysis is completely lost.
The Unspoken Language of Color Coding
One of the fastest ways to make your model look and feel professional is to adopt standard formatting conventions. The most important one by far is color-coding your cells. It’s a simple visual shorthand that every finance pro understands on sight.
The golden rule is dead simple:
- Blue Font: Use for any hard-coded number. These are your assumptions, historical data, and any input you manually type into a cell.
- Black Font: This is for all your formulas and calculations. It tells the user that the number is being calculated from other cells in the model.
- Green Font: This is often used to show that a cell is linking to a different worksheet within the same workbook.
This isn’t just about making things look nice; it’s about efficiency. When you or a colleague needs to update an assumption or audit a calculation, this system makes the process incredibly fast. It's a non-negotiable standard you'll find in guides on financial modeling best practices and on any investment banking desk.
Structuring for Intuitive Navigation
A great financial model has a logical flow. You should never force a user to jump back and forth between a dozen tabs just to follow a single calculation. A clean, intuitive layout is everything.
I always group my worksheets from left to right in a sequence that makes sense:
- Cover & Instructions: A quick overview of what the model does and any key instructions.
- Assumptions / Drivers: This is the command center. Every single input lives here.
- Core Model: The three statements—Income Statement, Balance Sheet, and Cash Flow.
- Supporting Schedules: This is where you build out the details for things like Depreciation, Working Capital, and Debt.
- Valuation: Your DCF, LBO, or whatever valuation method you're using.
- Outputs & Checks: A summary dashboard, charts, and your critical error checks.
Never, ever bury assumptions inside your formulas. Seeing
revenue * 1.08in a cell is a cardinal sin. Your formula should always link back to a clearly labeled "Revenue Growth Rate" cell on your Assumptions tab. This keeps everything transparent and makes it a breeze to run different scenarios.
Building Bulletproof Error Checks
An unbalanced balance sheet is the fastest way to get your model tossed in the trash during an interview. The single most critical check you must build confirms that Total Assets = Total Liabilities + Shareholder's Equity.
I recommend building a dedicated "Checks" section right at the top of your main model page or on its own tab. Think of this as your model’s warning system.
- Balance Sheet Check: Create a row that calculates
Assets - (Liabilities + Equity). This formula must equal zero for every single period. I use conditional formatting to make the cell flash bright red if it’s even a fraction off from zero. - Cash Flow Check: Make sure the ending cash balance on your cash flow statement links to and perfectly matches the cash line item on your balance sheet. This is a common source of errors.
- Circular Reference Warnings: Be paranoid about circular references, which can freeze or even crash your model. The moment you see one pop up, use Excel's error-checking tools to hunt it down and eliminate it.
This little "Checks" dashboard becomes your first stop when something looks off. You'll see the problem instantly without having to dig through hundreds of rows. More importantly, it shows an interviewer that you build with integrity and have a process for guaranteeing your work is accurate.
Common Financial Modeling Questions Answered

As you start building these models, you're bound to hit a few roadblocks. It happens to everyone. Getting clear on these common sticking points upfront can save you a ton of frustration, especially when you’re under the gun in an interview or on the job.
Here’s a no-nonsense breakdown of the questions I hear most often from up-and-coming analysts.
What Are the Most Common Mistakes in a Financial Model?
Honestly, the biggest screw-ups are usually the simplest. The most common mistake I see is people hardcoding inputs straight into their formulas. Instead, every assumption should be in a dedicated section and linked. It makes your model a nightmare to audit and impossible to run scenarios on.
Another classic is creating unintentional circular references that completely break your workbook. And of course, making assumptions that are just plucked from thin air is a huge red flag. An interviewer wants to see your logic, not a fantasy. Keep it clean, simple, and justifiable.
The single most telling mistake is an unbalanced balance sheet. It instantly signals a lack of attention to detail. This is exactly why a dedicated "Checks" section isn't just a nice-to-have—it's non-negotiable for any credible model.
How Long Should a Modeling Test Take?
In a typical investment banking or private equity interview, expect to get anywhere from two to four hours to build a three-statement model and valuation from a blank Excel sheet.
For more targeted exercises, like a quick-and-dirty "paper LBO," they might only give you 30 to 60 minutes. You get faster with practice, but speed isn't everything. Your accuracy and, crucially, your ability to explain why you made certain assumptions are what will make you stand out. That comes from repetition.
Which Excel Shortcuts Are Essential for Modeling?
You absolutely have to get away from using the mouse. It’s a dead giveaway of a junior analyst. Mastering keyboard shortcuts will literally cut your build time in half. There are hundreds out there, but you should nail these down first.
- Navigation:
Ctrl + Arrow Keyslets you jump to the end of a data block instantly. - Selection:
Ctrl + Shift + Arrow Keysis how you select entire rows or columns in a flash. - Pasting Special:
Alt + E, S, V(paste as values) is something you'll use constantly. - Grouping:
Alt + A, G, Gcleans up your model by grouping rows and columns. - Auditing:
Alt + M, P(trace precedents) andAlt + M, D(trace dependents) are lifesavers for finding errors.
How Can I Best Prepare for a Modeling Test?
There's no magic bullet here—just pure, hands-on practice. The only way to get good is to build dozens of models from scratch using the public filings of real companies. Doing this exposes you to different industries and all their weird accounting quirks.
Find case studies and run through them under a strict timer to mimic the pressure of a real test. Then, and this is key, practice explaining the story your numbers are telling. Say it out loud. The model is just a tool; it’s your analysis and communication that will get you the offer.
Of course, the model is just one piece of the puzzle. It's just as important to master your interview practice and nail the overall dynamic.
Ready to put this all into action? Soreno gives you an AI-powered platform with over 500 case studies and guided drills for finance and consulting interviews. You can practice live with an AI interviewer, get instant, rubric-based feedback, and track your progress to make sure you crush your next modeling test. Start your free trial at https://soreno.ai.