Top Market Sizing Interview Questions & Expert Tips
Master key market sizing interview questions with our expert frameworks, sample answers, and strategies to succeed in consulting interviews.

Market sizing interview questions are a cornerstone of consulting, finance, and product management interviews. Far from being simple math problems, they are a critical test of your structured thinking, logical reasoning, and business acumen. Interviewers use them to see how you tackle ambiguity, make reasonable assumptions, and communicate a complex analysis clearly and concisely. A strong performance demonstrates that you can break down a large, undefined problem into manageable components, a skill essential for any strategy role.
This comprehensive guide is designed to move beyond theory and provide you with actionable frameworks. We will dissect some of the most common market sizing interview questions, offering step-by-step solutions that you can adapt and apply. You won't just get the answers; you'll understand the strategic thinking behind them. Our goal is to equip you with the mental toolkit to confidently handle any estimation question thrown your way, moving you one step closer to landing that coveted offer.
Inside this article, you will find:
- Detailed Frameworks: Replicable, logical structures for both supply-side and demand-side problems.
- Step-by-Step Walkthroughs: Clear, easy-to-follow solutions for six classic and modern market sizing questions.
- Strategic Insights & Tips: Expert advice on making sound assumptions, performing sanity checks, and presenting your final answer with confidence.
We will explore everything from classic brain teasers like "How many golf balls can fit in a school bus?" to forward-looking strategic challenges such as "What is the market size for electric vehicles in California in 2025?". By mastering these examples, you'll be prepared for the full spectrum of challenges and ready to demonstrate your analytical prowess.
1. How many golf balls can fit in a school bus?
This is a quintessential brain teaser and a classic example of market sizing interview questions. It's designed to evaluate a candidate's logical reasoning and problem-structuring abilities rather than their knowledge of specific facts. The interviewer wants to see how you think, not if you know the exact answer. The goal is to break down an ambiguous, large-scale problem into a series of manageable, logical steps.

This question tests your ability to estimate, make sound assumptions, and perform back-of-the-envelope calculations under pressure. Success hinges on clearly articulating your thought process and justifying every assumption you make along the way.
Solving Framework and Sample Answer
The best approach is a top-down, volume-based calculation. You'll estimate the total available volume of the bus, calculate the volume of a single golf ball, and then adjust for the space that cannot be occupied.
Step 1: Estimate the dimensions of the school bus. State your assumptions clearly. Let's assume a standard school bus is approximately 50 feet long, 8 feet wide, and 8 feet high.
- Calculation: 50 ft x 8 ft x 8 ft = 3,200 cubic feet.
- Simplification: To make math easier, let's round this to 3,000 cubic feet.
Step 2: Account for unusable space. A bus is not an empty box. We need to subtract the volume taken up by seats, the engine, the driver's area, and the wheel wells.
- Assumption: Let's estimate that these components occupy about 25% of the internal volume.
- Calculation: 3,000 cubic feet * 0.75 (usable space) = 2,250 cubic feet.
Step 3: Estimate the volume of a golf ball. A golf ball is roughly a sphere with a diameter of about 1.5 inches. For simplicity, let's approximate it as a cube of 2 inches x 2 inches x 2 inches to account for initial packing inefficiency. This is a common simplification technique.
- Calculation: 2 in x 2 in x 2 in = 8 cubic inches.
- Conversion: We need to convert cubic feet to cubic inches. 1 cubic foot = 12^3 cubic inches = 1,728 cubic inches.
- Total Usable Volume (in inches): 2,250 cubic feet * 1,728 cubic inches/cubic foot ≈ 3,888,000 cubic inches.
Step 4: Adjust for packing efficiency. Spheres do not pack perfectly; there will be gaps. The optimal packing density for spheres (Kepler conjecture) is about 74%. A simpler, more conservative estimate for random packing is around 60-65%.
- Assumption: Let's assume a packing efficiency of 60%.
- Calculation (if using sphere volume): If you calculated the true volume of a sphere, you would divide the usable bus volume by the golf ball volume and then multiply by 0.60. Our cube approximation in Step 3 already accounts for some inefficiency, so this step becomes less critical but is good to mention.
Step 5: Calculate the final number. Divide the total usable volume by the volume of one golf ball.
- Final Calculation: 3,888,000 cubic inches / 8 cubic inches per ball ≈ 486,000 golf balls.
- Conclusion: "Based on these assumptions, I estimate that approximately 500,000 golf balls can fit into a school bus."
Strategic Takeaways
- Structure is King: The interviewer values your structured approach more than the final number. Clearly outline your steps before you begin calculating.
- Communicate Assumptions: State every assumption you make, such as the bus dimensions or the percentage of unusable space. This shows the interviewer you are self-aware and logical.
- Simplify the Math: Use round numbers. It reduces the chance of calculation errors and keeps the focus on your logic. Saying "let's round 1,728 to 1,700 for simplicity" is a sign of a good candidate.
- Sanity Check: Does the final answer seem reasonable? If you get a number like 50 million or 5,000, you likely made a calculation error. Briefly check your math out loud.
This type of question is a cornerstone of the problem-solving exercises you will find in many interviews. To see how these skills apply in a broader context, you can explore the fundamentals of the case study interview framework.
2. What is the size of the coffee market in the United States?
This question moves from a conceptual brain teaser to a realistic business problem, making it a staple in consulting interviews. It assesses your ability to structure a market sizing problem from first principles, segment a large population, and build a logical calculation based on reasonable assumptions. The interviewer wants to see if you can think like a business strategist by analyzing consumer behavior and market dynamics.

Unlike the "golf ball" question, this problem requires you to make informed assumptions about human behavior, demographics, and pricing. Your success will depend on your ability to break down the US population into logical consumer segments and estimate their spending habits.
Solving Framework and Sample Answer
A top-down approach, starting with the total population and segmenting it, is the most common and effective method here. Before starting, it is crucial to clarify with the interviewer if they are asking for market size in revenue ($) or volume (cups/lbs). Let's assume they want annual revenue.
Step 1: Start with the US Population and Segment It. State your top-level assumption. Let's assume the US population is approximately 330 million people. We can segment this by coffee-drinking habits.
- Assumption: Not everyone drinks coffee. Let's assume 80% of the population drinks coffee, as children and some adults do not. 330M * 0.80 = ~260 million coffee drinkers.
- Clarification: You could further segment this by age (e.g., 0-15 don't drink, 15-75 do, 75+ less so), but a simple percentage is often sufficient to start.
Step 2: Segment Coffee Drinkers by Consumption Frequency. Not all coffee drinkers consume the same amount. Let's break them into logical groups.
- Heavy Drinkers (50%): 130M people who drink 2 cups per day.
- Regular Drinkers (30%): 78M people who drink 1 cup per day.
- Occasional Drinkers (20%): 52M people who drink 1 cup per week.
Step 3: Estimate the Average Price Per Cup. The price varies significantly depending on where the coffee is consumed. We need to create a blended average price.
- Assumption - Consumption Location: Let's assume people brew at home (cheaper) vs. buying from a coffee shop (expensive). A reasonable split might be 70% of cups are consumed at home and 30% are bought out.
- Assumption - Pricing: Home-brewed coffee might cost ~$0.50 per cup. A purchased coffee might average ~$4.00 per cup.
- Blended Price Calculation: (70% * $0.50) + (30% * $4.00) = $0.35 + $1.20 = $1.55. Let's round to $1.50 per cup for easier math.
Step 4: Calculate the Total Annual Revenue. Now, combine the segments with the average price and time period.
- Heavy Drinkers: 130M people * 2 cups/day * $1.50/cup * 365 days/year ≈ $142B
- Regular Drinkers: 78M people * 1 cup/day * $1.50/cup * 365 days/year ≈ $43B
- Occasional Drinkers: 52M people * 1 cup/week * $1.50/cup = 78M/week * 52 weeks/year ≈ $4B
- Total Market Size: $142B + $43B + $4B = $189 Billion
Step 5: Sanity Check and Final Answer. Does this number seem plausible? The US GDP is over $20 trillion, so $189B is less than 1% of the economy, which feels reasonable for a single consumer product category.
- Conclusion: "Based on my assumptions about population, consumption habits, and a blended average price, I estimate the US coffee market to be approximately $190 billion annually. The key drivers are the large number of daily drinkers and the weighted average price between home and cafe consumption."
Strategic Takeaways
- Clarify Ambiguity: Always start by asking clarifying questions. "Are we estimating market size in terms of annual revenue or volume?" This shows precision and a business-oriented mindset.
- Segment Logically: Breaking the population into meaningful groups (e.g., by consumption frequency, location, or type of coffee) demonstrates strong analytical skills. It makes your assumptions more believable.
- Justify Your Numbers: Don't just pull numbers out of thin air. Briefly explain why you are choosing a certain percentage or price point. For instance, "I'm assuming 80% are coffee drinkers, excluding most children and some non-coffee-drinking adults, which seems like a reasonable starting point."
- Perform a Sanity Check: Comparing your final number to a known metric like GDP or the revenue of a large company (e.g., Starbucks' US revenue) can help validate your estimate and shows commercial awareness. The actual US coffee market is closer to $80-90 billion, but your process is what matters most.
3. How many gas stations are there in the United States?
This is a classic Fermi problem, a type of market sizing question that requires candidates to estimate a quantity that seems impossible to know. Unlike a pure volume question, this problem tests your ability to think about both supply and demand dynamics, business economics, and population-based logic. It's a favorite in consulting and finance interviews because it reveals how you deconstruct a market from different angles.
The interviewer isn't looking for the exact number of gas stations. Instead, they want to observe how you logically connect disparate pieces of information, such as population, driving habits, and station profitability, to arrive at a reasonable estimate. This question gauges your business acumen and comfort with ambiguity.
Solving Framework and Sample Answer
A strong approach involves creating two independent estimates, one from the demand side (how much gas is consumed) and one from the supply side (how many people a station can serve), and then comparing them. This triangulation method demonstrates a sophisticated thought process.
Approach 1: Demand-Side Estimation (Based on Fuel Consumption)
Step 1: Estimate the number of cars in the U.S. Start with the population and work down to the number of vehicles.
- Assumption: The U.S. population is roughly 330 million people. Let's assume an average household size of 2.5 people.
- Calculation: 330M people / 2.5 people per household ≈ 130 million households.
- Assumption: Not every household has a car, and some have multiple. Let's estimate an average of 2 cars per household, accounting for single-car and multi-car families.
- Calculation: 130M households * 2 cars/household = 260 million cars. (We can ignore commercial vehicles for simplicity and state this assumption).
Step 2: Calculate total annual gasoline demand. Now, estimate how much gasoline these cars consume.
- Assumption: The average car is driven 12,000 miles per year and has a fuel efficiency of 25 miles per gallon (MPG).
- Calculation (Gallons per car): 12,000 miles/year / 25 MPG = 480 gallons/year.
- Total Demand: 260M cars * 480 gallons/car ≈ 125 billion gallons per year.
Step 3: Estimate the throughput of a single gas station. Consider how much gas an average station sells.
- Assumption: A typical station might have 10 pumps. Each pump might serve a car every 10 minutes for 12 hours a day, and each car buys 10 gallons.
- Calculation (Gallons per day): 10 pumps * (6 cars/hour/pump) * 12 hours * 10 gallons/car = 7,200 gallons/day.
- Calculation (Gallons per year): 7,200 gallons/day * 365 days ≈ 2.6 million gallons/year. Let’s round this down to 2 million gallons/year to account for slower days.
Step 4: Calculate the total number of stations. Divide total demand by the capacity of a single station.
- Final Calculation: 125 billion gallons / 2 million gallons per station ≈ 62,500 stations.
Approach 2: Supply-Side Estimation (Population-Based)
Step 1: Estimate how many people one gas station can support. This is a much faster, top-down approach.
- Assumption: Think about your own town. A small town of 3,000 people might have one or two gas stations. A larger town of 30,000 might have ten. This suggests a ratio of about one station per 3,000 people.
Step 2: Calculate the total number of stations.
- Calculation: 330 million people / 3,000 people per station = 110,000 stations.
Step 3: Synthesize and conclude. Compare the two answers. The demand-side gave ~62,500 and the supply-side gave 110,000.
- Conclusion: "My demand-side analysis resulted in about 60,000 stations, while my population-based estimate gave 110,000. The demand-side number feels low, perhaps because I underestimated commercial vehicle fuel usage or overestimated station efficiency. The population-based figure feels more robust. Therefore, I'd estimate there are approximately 100,000 gas stations in the U.S." (The actual number is around 115,000-125,000).
Strategic Takeaways
- Triangulate Your Answer: Whenever possible, approach a market sizing question from two different angles (e.g., supply and demand). This demonstrates thoroughness and provides a way to sanity-check your own logic.
- Think in Ratios: Using ratios like "people per station" or "cars per household" is a powerful simplification technique that interviewers appreciate. It shows you can find simple proxies for complex behaviors.
- State Assumptions About Scope: Clearly state what you are including and excluding. For instance, clarifying that you are focusing on personal vehicles and excluding large commercial trucks simplifies the problem and shows you are in control of the analysis.
- Reason Through Your Discrepancies: If your different approaches yield different results, don't ignore it. Discussing why they might be different (e.g., "my first assumption about X was likely too conservative") is a sign of a highly analytical candidate.
4. Estimate the annual revenue of McDonald's in New York City
This common market sizing question pushes beyond simple volume estimation into the realm of business operations and revenue modeling. It requires you to structure a problem by breaking down a large, complex market (NYC fast food) into manageable components like the number of stores, customer traffic, and average spending. Interviewers use this question to assess your ability to apply business logic and segment a market geographically and by consumer behavior.

The key to success is demonstrating a thoughtful, layered approach. You must consider variables like location type (tourist-heavy vs. residential), time of day, and differences in pricing and demand across the city's diverse boroughs. This shows you can think like a business strategist, not just a calculator.
Solving Framework and Sample Answer
A strong approach is a bottom-up calculation: estimate the revenue of a single average store and then multiply by the total number of stores. The best answers will add layers of segmentation to this model.
Step 1: Clarify Scope and Estimate the Number of Locations. First, define "New York City" as all five boroughs. NYC has a population of about 8 million people.
- Assumption: Let's assume there's one McDonald's for every 25,000 people. This is a common starting point for ubiquitous chains.
- Calculation: 8,000,000 people / 25,000 people per location = 320 locations.
- Simplification: Let’s round this down to 300 locations for easier math.
Step 2: Segment Locations and Estimate Daily Revenue per Store. Not all locations are equal. A Times Square McDonald's will have far more traffic than one in a quiet residential neighborhood. Let's create two segments.
- Assumption 1 (High-Traffic): 20% of locations (60 stores) are in high-traffic areas (Midtown Manhattan, transportation hubs). Let's say they serve 2,000 customers/day with an average check of $10.
- Calculation: 60 stores * 2,000 customers/day * $10/customer = $1,200,000 per day.
- Assumption 2 (Standard-Traffic): 80% of locations (240 stores) are in residential or lower-traffic areas. Let's say they serve 800 customers/day with an average check of $8.
- Calculation: 240 stores * 800 customers/day * $8/customer = $1,536,000 per day.
Step 3: Calculate Total Daily and Annual Revenue. Add the revenue from both segments and extrapolate for the year.
- Total Daily Revenue: $1,200,000 (High-Traffic) + $1,536,000 (Standard-Traffic) = $2,736,000.
- Assumption: Let's assume stores are open 360 days a year to account for holidays or unforeseen closures.
- Total Annual Revenue: $2,736,000/day * 360 days/year ≈ $985 million.
Step 4: State Final Answer and Perform a Sanity Check. Finalize your estimate with a clear concluding statement.
- Conclusion: "Based on my assumptions about location count, traffic segmentation, and average check size, I estimate the annual revenue of McDonald's in New York City to be approximately $985 million, or just under $1 billion."
- Sanity Check: Does nearly $1 billion seem plausible for a global giant in one of the world's largest cities? Yes, it falls within a reasonable range.
Strategic Takeaways
- Segment, Segment, Segment: The most impressive answers will segment the problem. You can segment by borough, location type (freestanding vs. food court), or time of day (breakfast, lunch, dinner). This demonstrates sophisticated business acumen.
- Justify Your Numbers: Don't just pull numbers out of thin air. Justify your estimate for the number of locations using population. Justify your average check size based on a sample meal (e.g., a Big Mac meal costs about $9-$10).
- Think About the Drivers: What drives revenue? It's the number of stores, customers per store, and spend per customer. Clearly articulating this framework (Revenue = # Stores x # Customers/Store x $/Customer) shows you understand the fundamentals.
- Use a Top-Down Sanity Check: You can quickly check your bottom-up answer. For example: "The US fast-food market is about $300B. NYC is ~2.5% of the US population, so its fast-food market might be ~$7.5B. McDonald's has ~10% market share, which would be $750M." This shows your initial estimate is in the right ballpark.
This question is a great example of the practical business problems you might face in consulting or finance. For more practice with similar logic, you can explore other common finance interview questions and answers.
5. How many piano tuners are there in Chicago?
This question is arguably the most famous Fermi problem, named after the physicist Enrico Fermi who used it to teach his students the power of estimation. It’s a classic among market sizing interview questions because it forces the candidate to build a logical framework from scratch, relying on common sense assumptions about society and business. The interviewer isn't looking for your knowledge of the music industry; they want to see if you can deconstruct a complex question into a supply-and-demand equation.
The core task is to estimate the total demand for piano tuning in a given year and then divide that by the annual capacity of a single piano tuner. Success depends on your ability to logically connect population demographics to service demand.
Solving Framework and Sample Answer
The best approach is a demand-driven calculation. Start with the total population and narrow it down to the number of tunings required per year. Then, estimate the supply side (a tuner's capacity) to find the total number of tuners needed.
Step 1: Estimate the total number of pianos in Chicago. Start with the population and work down to households. Make assumptions about piano ownership.
- Assumption: The population of Chicago is roughly 3 million people. The average household size is about 3 people.
- Calculation (Households): 3,000,000 people / 3 people per household = 1,000,000 households.
- Assumption (Ownership): Piano ownership is not extremely common. Let's assume 1 in 20 households owns a piano, which is a 5% ownership rate.
- Calculation (Pianos): 1,000,000 households * 0.05 = 50,000 pianos in homes.
- Refinement: We should also consider institutional pianos (schools, concert halls, churches). Let's add a 10% buffer for these. 50,000 * 1.10 = 55,000 total pianos. Let’s round to 50,000 for easier math.
Step 2: Estimate the total annual demand for piano tuning. Not every piano is tuned every year. We need to assume a tuning frequency.
- Assumption: Serious musicians might tune their pianos annually, but many casual owners do so less frequently. Let's assume, on average, a piano is tuned once every two years.
- Calculation (Annual Tunings): 50,000 pianos / 2 years = 25,000 tunings per year.
Step 3: Estimate the capacity of a single piano tuner. Now, let's figure out how many jobs one full-time piano tuner can handle in a year.
- Assumption (Daily Work): A tuning takes time, plus travel. Let's say a tuner can complete 2 tunings per day.
- Assumption (Working Days): A tuner works 5 days a week for 50 weeks a year (allowing for 2 weeks of vacation).
- Calculation (Annual Capacity): 2 tunings/day * 5 days/week * 50 weeks/year = 500 tunings per year.
Step 4: Calculate the final number of piano tuners. Divide the total annual demand by the annual capacity of one tuner.
- Final Calculation: 25,000 total annual tunings / 500 tunings per tuner = 50 piano tuners.
- Conclusion: "Based on my assumptions about population, piano ownership, and tuning frequency, I estimate there are approximately 50 full-time piano tuners in Chicago."
Strategic Takeaways
- Build a Logical Chain: This problem is all about linking distinct assumptions. The population leads to households, which leads to pianos, which leads to tunings (demand). A tuner's schedule leads to their annual capacity (supply). The final answer connects demand and supply.
- Segment Your Thinking: A great way to add nuance is to segment the market. For instance, you could break down households by income level (e.g., "higher-income households are more likely to own pianos") or consider residential vs. institutional pianos separately.
- Justify Every Assumption: Why 1 in 20 households? You could say, "It feels like a luxury item, not as common as a TV but more common than, say, a sailboat. So 5% seems like a reasonable starting point." This justification is more important than the number itself.
- State Your Final Answer as a Range: Concluding with a range shows you understand the imprecision of your estimates. You could say, "My estimate is 50, but given the uncertainties in ownership and tuning frequency, the actual number could reasonably be between 35 and 65." This demonstrates commercial awareness.
6. What is the market size for electric vehicles in California in 2025?
This forward-looking market sizing interview question moves beyond static estimation into the realm of strategic forecasting. It tests your ability to project market trends by synthesizing data points like current adoption rates, regulatory policies, and technological advancements. Interviewers use this question to gauge your business acumen and understanding of market dynamics, not just your calculation skills.
This question requires you to analyze the current market and project its evolution, making reasoned assumptions about growth factors. Success depends on building a logical argument for your forecast, considering both growth drivers and potential limiters.
Solving Framework and Sample Answer
A strong approach combines a top-down analysis of the total vehicle market with a bottom-up forecast of EV penetration growth. It is crucial to clarify if the interviewer is asking for the annual sales market size (new units sold in 2025) or the total fleet size (all EVs on the road). Let's assume they mean annual sales revenue.
Step 1: Define the Total Addressable Market (TAM). Start with the total number of new passenger vehicles sold annually in California. This is our baseline.
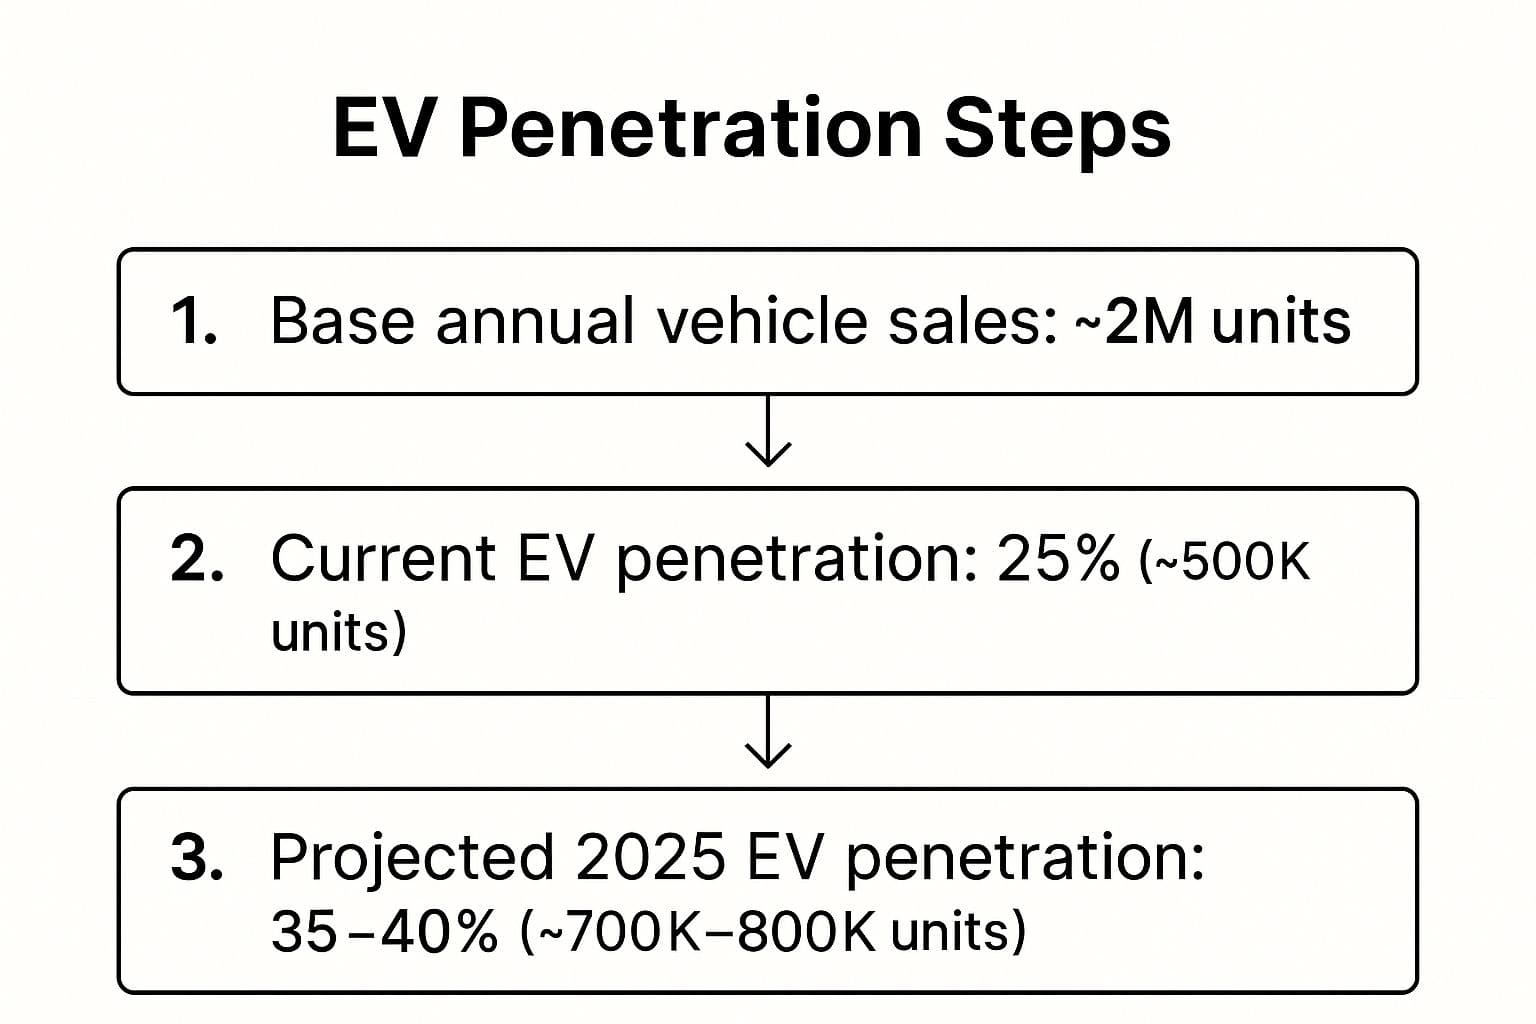
- Assumption: The California new car market is relatively stable. Let's assume it's approximately 2 million new vehicles sold per year.
Step 2: Determine the current EV penetration and project it forward. Analyze the current market share of EVs and forecast its growth to 2025. This is the most critical part of the estimation.
- Known Data: Let's say we know that in 2023, EV penetration of new car sales in California was about 25%. This means 2 million * 0.25 = 500,000 EVs were sold.
- Growth Assumption: California has strong zero-emission vehicle (ZEV) mandates and consumer adoption is accelerating due to more models, better infrastructure, and high gas prices. I'll project that the penetration rate will grow to between 35% and 40% by 2025. This shows I'm considering a range.
- Calculation (2025 Units): 2,000,000 vehicles * 35% = 700,000 EVs. Let's use this as our conservative estimate for unit sales in 2025.
Step 3: Estimate the average price per vehicle. To find the revenue market size, we need to estimate the average selling price (ASP) of a new EV. This will vary widely from a Nissan Leaf to a Porsche Taycan.
- Assumption: The EV market is moving towards more mainstream models, but premium brands still hold significant share. Let's assume an average price of $50,000 per vehicle, blending higher-end and lower-end models.
Step 4: Calculate the final market size. Multiply the projected unit sales by the estimated average price to get the total annual revenue.
- Final Calculation: 700,000 EV units * $50,000/unit = $35 billion.
- Conclusion: "Based on my assumptions regarding a stable total car market and a projected EV penetration of 35%, I estimate the annual market size for new electric vehicles in California in 2025 to be approximately $35 billion. The range could be up to $40 billion if penetration reaches 40%."
Strategic Takeaways
- Acknowledge Uncertainty: Forecasting is inherently uncertain. Using a range (e.g., 35-40% penetration) demonstrates commercial awareness and a nuanced understanding of the problem.
- Justify Your Projections: Your growth assumption is the core of the answer. Justify it by mentioning specific drivers like government mandates (California's ZEV program), improving charging infrastructure, battery cost reduction, and wider model availability.
- Clarify the Scope: Always start by clarifying the question. "Are we talking about annual sales revenue, total units sold, or the total number of EVs on the road?" This simple question shows you are precise and structured.
- Show Industry Awareness: Mentioning specific, relevant facts (even if approximate), such as California's leadership in EV adoption or key regulations, will significantly strengthen your answer. This is a common topic in consulting, and knowing the basics is a great way to prepare for your consulting interview.
Market Sizing Question Comparison
| Question Title | Implementation Complexity 🔄 | Resource Requirements ⚡ | Expected Outcomes 📊 | Ideal Use Cases 💡 | Key Advantages ⭐ |
|---|---|---|---|---|---|
| How many golf balls can fit in a school bus? | Medium: pure estimation with volume math | Low: no special data, only math | Demonstrates structured thinking and math | Assessing spatial reasoning, quick math estimation | Level playing field; clear assumption articulation |
| What is the size of the coffee market in US? | Easy to Medium: requires segmentation logic | Medium: demographic & market data | Realistic market sizing with revenue/volume | Market sizing with consumer behavior assumptions | Relevant real-world problem; multiple segmentation |
| How many gas stations in the US? | Medium: dual demand-supply side analysis | Medium: industry & behavior data | Triangulated estimate of infrastructure size | Understanding business unit economics and supply-demand | Multi-faceted problem-solving; market equilibrium |
| Estimate McDonald's annual revenue in NYC | Medium to Hard: multi-segmentation & economics | Medium to High: location & traffic | Revenue estimate combining operations data | Retail/restaurant business sizing and operational insight | Practical business focus; multi-dimensional approach |
| How many piano tuners are there in Chicago? | Medium: chained assumptions, classic Fermi | Low: mainly logical assumptions | Systematic estimate with uncertainty handling | Analytical reasoning, compounding assumptions | Pure reasoning; historic consulting significance |
| Electric vehicle market size in California 2025 | Hard: forward-looking with trend & policy analysis | High: market projections & policy | Forecasting future market size with variables | Strategy consulting; tech adoption and regulation | Tests strategic & industry knowledge; multiple factors |
From Theory to Practice: Your Next Steps to Market Sizing Mastery
You’ve now journeyed through a comprehensive breakdown of several classic market sizing interview questions. From the seemingly absurd (golf balls in a bus) to the strategically complex (future EV market in California), a clear pattern emerges. Success isn't about pulling a magic number out of a hat; it’s about demonstrating a structured, logical, and commercially-aware thought process.
The final answer is a byproduct of a strong methodology. Your interviewer is far more interested in how you think than what you calculate. They want to see if you can take an ambiguous, intimidating problem and confidently break it down into manageable, logical components. Can you state your assumptions clearly? Can you perform quick, back-of-the-envelope math? Can you sanity-check your results and communicate your framework effectively? These are the core skills on display.
The Three Pillars of Market Sizing Success
As we've seen across the examples, your performance rests on three critical pillars. Mastering these will transform your approach from hesitant guessing to confident analysis.
-
Structured Thinking: Before you say a single number, you must present a clear roadmap. Whether it’s a top-down approach starting with the total population or a bottom-up calculation from individual units, your framework is your foundation. Announcing your structure upfront shows the interviewer you are in control.
-
Reasonable Assumptions: Every market sizing problem is built on a series of well-reasoned assumptions. Justifying why you chose a specific number (e.g., "I'll assume a 3% adoption rate for high-end coffee machines because it's a luxury good, not a necessity") is more important than the number itself. This is where you demonstrate business acumen and common sense.
-
Clear Communication: A brilliant analysis is useless if the interviewer can't follow it. You must act as a guide, walking them through each step of your calculation. Articulate your logic, check in for questions, and present your final answer with a summary of its key drivers and potential limitations.
Turning Knowledge into Instinct
Reading about frameworks is the first step, but it is not enough to secure an offer. True mastery comes from practice, turning conscious, deliberate steps into second nature. The pressure of a live interview can make even simple calculations feel monumental. The only way to build resilience is through consistent, targeted repetition.
Your goal is to reach a point where structuring a problem is automatic. You want to have common data points (like the U.S. population or average household size) at your fingertips. You need to develop the "muscle memory" to break down any market sizing interview questions thrown your way, no matter how unfamiliar they seem.
Here is an actionable plan to get there:
- Re-solve the Classics: Take the questions from this article and solve them yourself without looking at the solutions. Use a whiteboard or a piece of paper to practice structuring your thoughts visually.
- Time Yourself: Set a timer for 10-15 minutes per problem to simulate the time constraints of a real interview. This will train you to be both structured and efficient.
- Practice Out Loud: The most critical and often overlooked step is to articulate your entire thought process as if an interviewer were in the room. This hones your communication skills and reveals gaps in your logic.
- Seek Feedback: Practice with peers, career services, or mentors. Ask them specifically to critique your structure, the clarity of your assumptions, and the flow of your communication.
Mastering market sizing interview questions is a powerful signal to top firms that you possess the raw analytical and problem-solving talent they covet. It demonstrates your ability to handle ambiguity with structure, a skill that is central to any role in strategy, consulting, or finance. By moving from passive learning to active, deliberate practice, you are not just preparing for an interview; you are building a foundational skill for a successful career.
Ready to move beyond theory and build the confidence to ace any case interview? Soreno provides an AI-powered platform with an extensive library of drills and full case studies, allowing you to practice with an AI interviewer that gives you instant, personalized feedback. Refine your structure, communication, and quantitative skills by simulating the real interview experience on Soreno.